Immigrants from Western Asia vs Immigrants from Asia Kindergarten
COMPARE
Immigrants from Western Asia
Immigrants from Asia
Kindergarten
Kindergarten Comparison
Immigrants from Western Asia
Immigrants from Asia
97.7%
KINDERGARTEN
2.1/ 100
METRIC RATING
236th/ 347
METRIC RANK
97.6%
KINDERGARTEN
0.8/ 100
METRIC RATING
254th/ 347
METRIC RANK
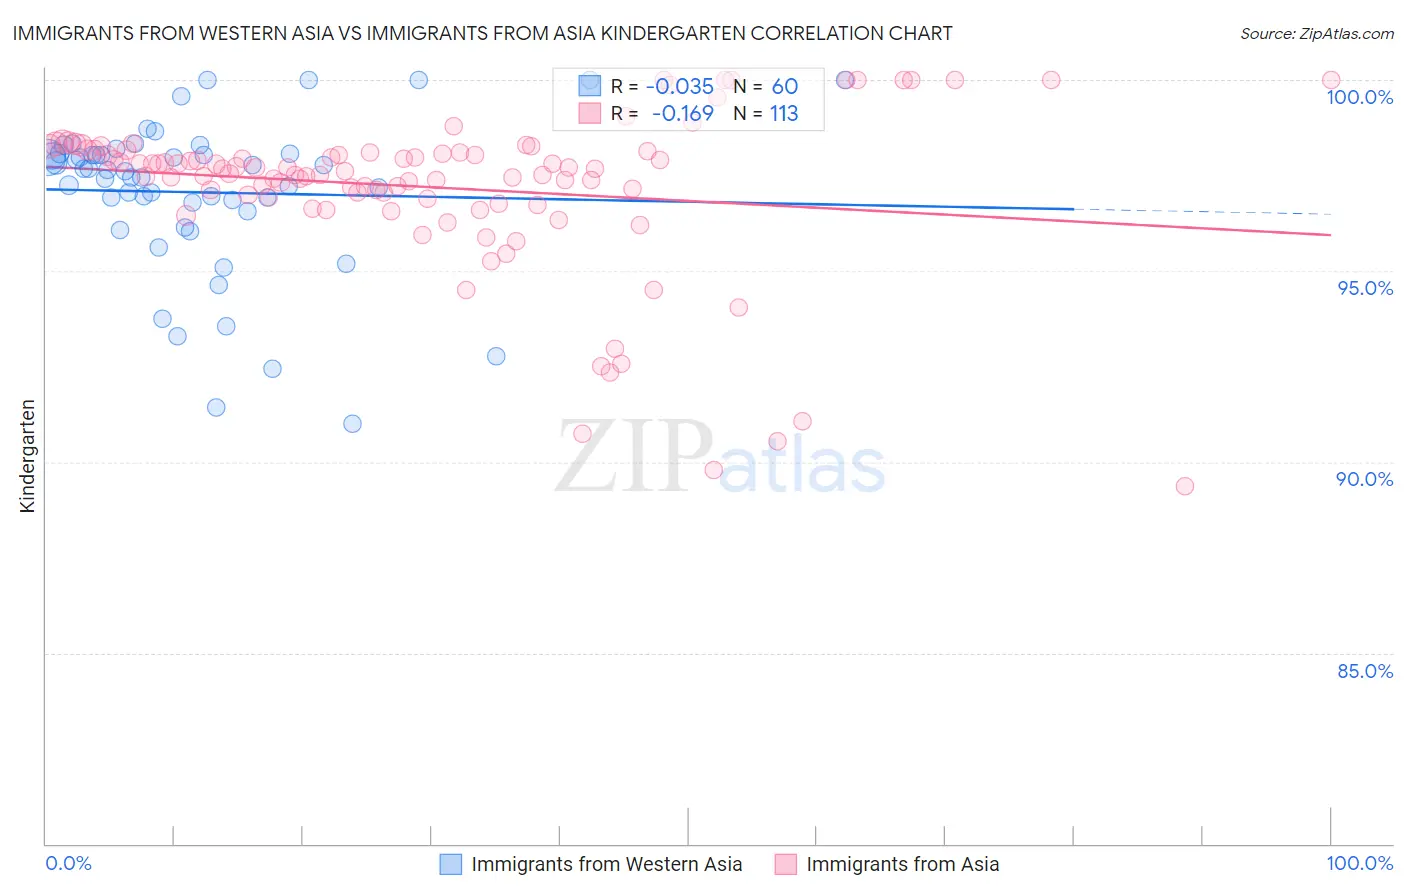
Immigrants from Western Asia vs Immigrants from Asia Kindergarten Correlation Chart
The statistical analysis conducted on geographies consisting of 404,424,892 people shows no correlation between the proportion of Immigrants from Western Asia and percentage of population with at least kindergarten education in the United States with a correlation coefficient (R) of -0.035 and weighted average of 97.7%. Similarly, the statistical analysis conducted on geographies consisting of 549,170,546 people shows a poor negative correlation between the proportion of Immigrants from Asia and percentage of population with at least kindergarten education in the United States with a correlation coefficient (R) of -0.169 and weighted average of 97.6%, a difference of 0.080%.
Kindergarten Correlation Summary
| Measurement | Immigrants from Western Asia | Immigrants from Asia |
| Minimum | 91.0% | 89.4% |
| Maximum | 100.0% | 100.0% |
| Range | 9.0% | 10.6% |
| Mean | 97.1% | 97.2% |
| Median | 97.6% | 97.7% |
| Interquartile 25% (IQ1) | 96.7% | 96.9% |
| Interquartile 75% (IQ3) | 98.1% | 98.1% |
| Interquartile Range (IQR) | 1.4% | 1.2% |
| Standard Deviation (Sample) | 2.0% | 2.1% |
| Standard Deviation (Population) | 2.0% | 2.1% |
Demographics Similar to Immigrants from Western Asia and Immigrants from Asia by Kindergarten
In terms of kindergarten, the demographic groups most similar to Immigrants from Western Asia are Colombian (97.7%, a difference of 0.0%), Nigerian (97.6%, a difference of 0.010%), Immigrants from Eastern Asia (97.6%, a difference of 0.020%), U.S. Virgin Islander (97.6%, a difference of 0.020%), and Korean (97.6%, a difference of 0.020%). Similarly, the demographic groups most similar to Immigrants from Asia are Immigrants from Congo (97.6%, a difference of 0.0%), Ethiopian (97.6%, a difference of 0.010%), Immigrants from Iraq (97.6%, a difference of 0.010%), Immigrants from Africa (97.6%, a difference of 0.010%), and Indian (Asian) (97.6%, a difference of 0.020%).
| Demographics | Rating | Rank | Kindergarten |
| Colombians | 2.2 /100 | #235 | Tragic 97.7% |
| Immigrants | Western Asia | 2.1 /100 | #236 | Tragic 97.7% |
| Nigerians | 1.8 /100 | #237 | Tragic 97.6% |
| Immigrants | Eastern Asia | 1.7 /100 | #238 | Tragic 97.6% |
| U.S. Virgin Islanders | 1.7 /100 | #239 | Tragic 97.6% |
| Koreans | 1.6 /100 | #240 | Tragic 97.6% |
| Liberians | 1.3 /100 | #241 | Tragic 97.6% |
| Immigrants | Indonesia | 1.3 /100 | #242 | Tragic 97.6% |
| Asians | 1.2 /100 | #243 | Tragic 97.6% |
| Bolivians | 1.2 /100 | #244 | Tragic 97.6% |
| South Americans | 1.1 /100 | #245 | Tragic 97.6% |
| Indians (Asian) | 1.0 /100 | #246 | Tragic 97.6% |
| Immigrants | Eastern Africa | 1.0 /100 | #247 | Tragic 97.6% |
| Immigrants | Middle Africa | 1.0 /100 | #248 | Tragic 97.6% |
| Peruvians | 1.0 /100 | #249 | Tragic 97.6% |
| Immigrants | Senegal | 0.9 /100 | #250 | Tragic 97.6% |
| Ethiopians | 0.9 /100 | #251 | Tragic 97.6% |
| Immigrants | Iraq | 0.9 /100 | #252 | Tragic 97.6% |
| Immigrants | Africa | 0.8 /100 | #253 | Tragic 97.6% |
| Immigrants | Asia | 0.8 /100 | #254 | Tragic 97.6% |
| Immigrants | Congo | 0.8 /100 | #255 | Tragic 97.6% |