Immigrants from Western Asia vs Honduran Master's Degree
COMPARE
Immigrants from Western Asia
Honduran
Master's Degree
Master's Degree Comparison
Immigrants from Western Asia
Hondurans
17.5%
MASTER'S DEGREE
99.5/ 100
METRIC RATING
81st/ 347
METRIC RANK
11.9%
MASTER'S DEGREE
0.2/ 100
METRIC RATING
283rd/ 347
METRIC RANK
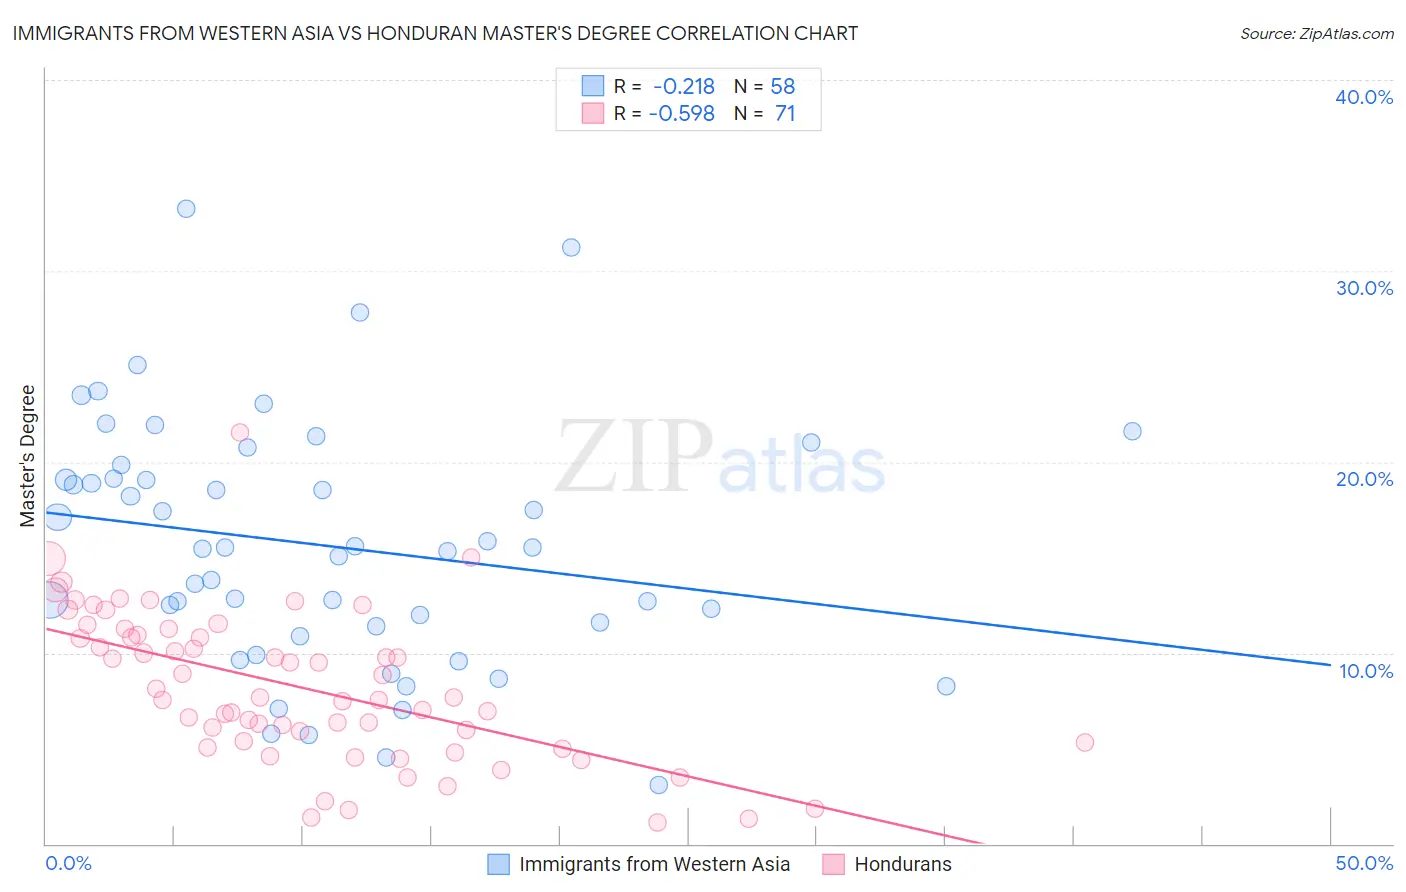
Immigrants from Western Asia vs Honduran Master's Degree Correlation Chart
The statistical analysis conducted on geographies consisting of 404,328,411 people shows a weak negative correlation between the proportion of Immigrants from Western Asia and percentage of population with at least master's degree education in the United States with a correlation coefficient (R) of -0.218 and weighted average of 17.5%. Similarly, the statistical analysis conducted on geographies consisting of 357,698,981 people shows a substantial negative correlation between the proportion of Hondurans and percentage of population with at least master's degree education in the United States with a correlation coefficient (R) of -0.598 and weighted average of 11.9%, a difference of 46.1%.
Master's Degree Correlation Summary
| Measurement | Immigrants from Western Asia | Honduran |
| Minimum | 3.1% | 1.1% |
| Maximum | 33.2% | 21.5% |
| Range | 30.2% | 20.4% |
| Mean | 15.6% | 8.2% |
| Median | 15.5% | 7.6% |
| Interquartile 25% (IQ1) | 11.4% | 5.3% |
| Interquartile 75% (IQ3) | 19.1% | 10.9% |
| Interquartile Range (IQR) | 7.8% | 5.6% |
| Standard Deviation (Sample) | 6.4% | 3.9% |
| Standard Deviation (Population) | 6.4% | 3.9% |
Similar Demographics by Master's Degree
Demographics Similar to Immigrants from Western Asia by Master's Degree
In terms of master's degree, the demographic groups most similar to Immigrants from Western Asia are Greek (17.5%, a difference of 0.050%), Immigrants from Zimbabwe (17.4%, a difference of 0.11%), Carpatho Rusyn (17.5%, a difference of 0.30%), Immigrants from Lebanon (17.5%, a difference of 0.35%), and Immigrants from Scotland (17.4%, a difference of 0.44%).
| Demographics | Rating | Rank | Master's Degree |
| Immigrants | Romania | 99.7 /100 | #74 | Exceptional 17.7% |
| Egyptians | 99.6 /100 | #75 | Exceptional 17.6% |
| Immigrants | Indonesia | 99.6 /100 | #76 | Exceptional 17.6% |
| Immigrants | Eastern Europe | 99.6 /100 | #77 | Exceptional 17.6% |
| Immigrants | Hungary | 99.6 /100 | #78 | Exceptional 17.5% |
| Immigrants | Lebanon | 99.6 /100 | #79 | Exceptional 17.5% |
| Carpatho Rusyns | 99.6 /100 | #80 | Exceptional 17.5% |
| Immigrants | Western Asia | 99.5 /100 | #81 | Exceptional 17.5% |
| Greeks | 99.5 /100 | #82 | Exceptional 17.5% |
| Immigrants | Zimbabwe | 99.5 /100 | #83 | Exceptional 17.4% |
| Immigrants | Scotland | 99.4 /100 | #84 | Exceptional 17.4% |
| Immigrants | Brazil | 99.4 /100 | #85 | Exceptional 17.4% |
| Immigrants | Croatia | 99.3 /100 | #86 | Exceptional 17.3% |
| Maltese | 99.3 /100 | #87 | Exceptional 17.3% |
| Immigrants | Canada | 99.2 /100 | #88 | Exceptional 17.2% |
Demographics Similar to Hondurans by Master's Degree
In terms of master's degree, the demographic groups most similar to Hondurans are Immigrants from El Salvador (12.0%, a difference of 0.41%), Malaysian (12.0%, a difference of 0.72%), Ottawa (11.9%, a difference of 0.72%), Immigrants from Dominican Republic (12.1%, a difference of 0.85%), and Immigrants from Belize (12.1%, a difference of 0.90%).
| Demographics | Rating | Rank | Master's Degree |
| Blacks/African Americans | 0.3 /100 | #276 | Tragic 12.1% |
| Immigrants | Caribbean | 0.3 /100 | #277 | Tragic 12.1% |
| Potawatomi | 0.3 /100 | #278 | Tragic 12.1% |
| Immigrants | Belize | 0.2 /100 | #279 | Tragic 12.1% |
| Immigrants | Dominican Republic | 0.2 /100 | #280 | Tragic 12.1% |
| Malaysians | 0.2 /100 | #281 | Tragic 12.0% |
| Immigrants | El Salvador | 0.2 /100 | #282 | Tragic 12.0% |
| Hondurans | 0.2 /100 | #283 | Tragic 11.9% |
| Ottawa | 0.2 /100 | #284 | Tragic 11.9% |
| Immigrants | Nicaragua | 0.2 /100 | #285 | Tragic 11.8% |
| Aleuts | 0.1 /100 | #286 | Tragic 11.8% |
| Immigrants | Haiti | 0.1 /100 | #287 | Tragic 11.8% |
| Immigrants | Honduras | 0.1 /100 | #288 | Tragic 11.8% |
| Guatemalans | 0.1 /100 | #289 | Tragic 11.7% |
| Ute | 0.1 /100 | #290 | Tragic 11.7% |