Immigrants from West Indies vs Immigrants from South Central Asia 8th Grade
COMPARE
Immigrants from West Indies
Immigrants from South Central Asia
8th Grade
8th Grade Comparison
Immigrants from West Indies
Immigrants from South Central Asia
94.3%
8TH GRADE
0.0/ 100
METRIC RATING
290th/ 347
METRIC RANK
96.1%
8TH GRADE
89.4/ 100
METRIC RATING
140th/ 347
METRIC RANK
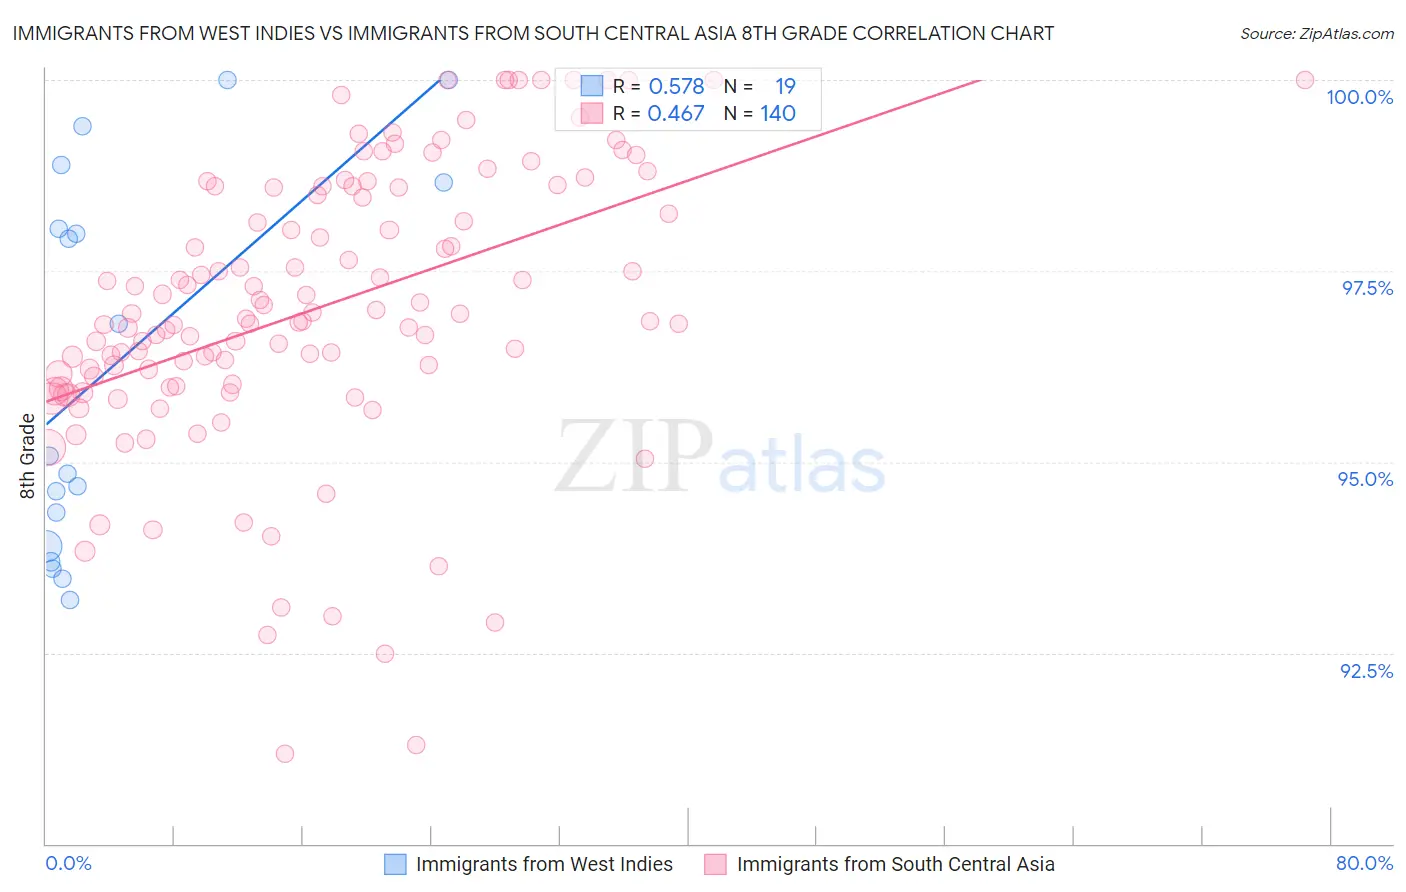
Immigrants from West Indies vs Immigrants from South Central Asia 8th Grade Correlation Chart
The statistical analysis conducted on geographies consisting of 72,457,514 people shows a substantial positive correlation between the proportion of Immigrants from West Indies and percentage of population with at least 8th grade education in the United States with a correlation coefficient (R) of 0.578 and weighted average of 94.3%. Similarly, the statistical analysis conducted on geographies consisting of 473,113,181 people shows a moderate positive correlation between the proportion of Immigrants from South Central Asia and percentage of population with at least 8th grade education in the United States with a correlation coefficient (R) of 0.467 and weighted average of 96.1%, a difference of 1.8%.
8th Grade Correlation Summary
| Measurement | Immigrants from West Indies | Immigrants from South Central Asia |
| Minimum | 93.2% | 91.2% |
| Maximum | 100.0% | 100.0% |
| Range | 6.8% | 8.8% |
| Mean | 96.3% | 97.0% |
| Median | 95.1% | 96.9% |
| Interquartile 25% (IQ1) | 93.9% | 96.0% |
| Interquartile 75% (IQ3) | 98.7% | 98.6% |
| Interquartile Range (IQR) | 4.8% | 2.6% |
| Standard Deviation (Sample) | 2.5% | 1.8% |
| Standard Deviation (Population) | 2.4% | 1.8% |
Similar Demographics by 8th Grade
Demographics Similar to Immigrants from West Indies by 8th Grade
In terms of 8th grade, the demographic groups most similar to Immigrants from West Indies are Immigrants from Grenada (94.3%, a difference of 0.010%), British West Indian (94.4%, a difference of 0.070%), Bangladeshi (94.3%, a difference of 0.080%), Yaqui (94.2%, a difference of 0.11%), and Houma (94.2%, a difference of 0.12%).
| Demographics | Rating | Rank | 8th Grade |
| Immigrants | St. Vincent and the Grenadines | 0.1 /100 | #283 | Tragic 94.6% |
| Immigrants | Philippines | 0.1 /100 | #284 | Tragic 94.6% |
| Immigrants | Barbados | 0.0 /100 | #285 | Tragic 94.5% |
| Immigrants | Peru | 0.0 /100 | #286 | Tragic 94.5% |
| Tohono O'odham | 0.0 /100 | #287 | Tragic 94.5% |
| Malaysians | 0.0 /100 | #288 | Tragic 94.5% |
| British West Indians | 0.0 /100 | #289 | Tragic 94.4% |
| Immigrants | West Indies | 0.0 /100 | #290 | Tragic 94.3% |
| Immigrants | Grenada | 0.0 /100 | #291 | Tragic 94.3% |
| Bangladeshis | 0.0 /100 | #292 | Tragic 94.3% |
| Yaqui | 0.0 /100 | #293 | Tragic 94.2% |
| Houma | 0.0 /100 | #294 | Tragic 94.2% |
| Fijians | 0.0 /100 | #295 | Tragic 94.2% |
| Haitians | 0.0 /100 | #296 | Tragic 94.2% |
| Immigrants | South Eastern Asia | 0.0 /100 | #297 | Tragic 94.2% |
Demographics Similar to Immigrants from South Central Asia by 8th Grade
In terms of 8th grade, the demographic groups most similar to Immigrants from South Central Asia are Burmese (96.1%, a difference of 0.010%), Hmong (96.1%, a difference of 0.010%), Cambodian (96.1%, a difference of 0.020%), Immigrants from Turkey (96.1%, a difference of 0.040%), and Immigrants from Hungary (96.1%, a difference of 0.040%).
| Demographics | Rating | Rank | 8th Grade |
| Immigrants | Turkey | 91.7 /100 | #133 | Exceptional 96.1% |
| Immigrants | Hungary | 91.5 /100 | #134 | Exceptional 96.1% |
| Basques | 91.5 /100 | #135 | Exceptional 96.1% |
| Jordanians | 91.3 /100 | #136 | Exceptional 96.1% |
| Cambodians | 90.6 /100 | #137 | Exceptional 96.1% |
| Burmese | 90.2 /100 | #138 | Exceptional 96.1% |
| Hmong | 89.7 /100 | #139 | Excellent 96.1% |
| Immigrants | South Central Asia | 89.4 /100 | #140 | Excellent 96.1% |
| Immigrants | Greece | 85.9 /100 | #141 | Excellent 96.0% |
| Immigrants | Eastern Europe | 85.4 /100 | #142 | Excellent 96.0% |
| Spanish | 85.1 /100 | #143 | Excellent 96.0% |
| Immigrants | Belarus | 84.8 /100 | #144 | Excellent 96.0% |
| Lumbee | 84.1 /100 | #145 | Excellent 96.0% |
| Israelis | 84.1 /100 | #146 | Excellent 96.0% |
| Colville | 84.0 /100 | #147 | Excellent 96.0% |