Immigrants from West Indies vs Dominican 11th Grade
COMPARE
Immigrants from West Indies
Dominican
11th Grade
11th Grade Comparison
Immigrants from West Indies
Dominicans
90.4%
11TH GRADE
0.0/ 100
METRIC RATING
286th/ 347
METRIC RANK
87.7%
11TH GRADE
0.0/ 100
METRIC RATING
326th/ 347
METRIC RANK
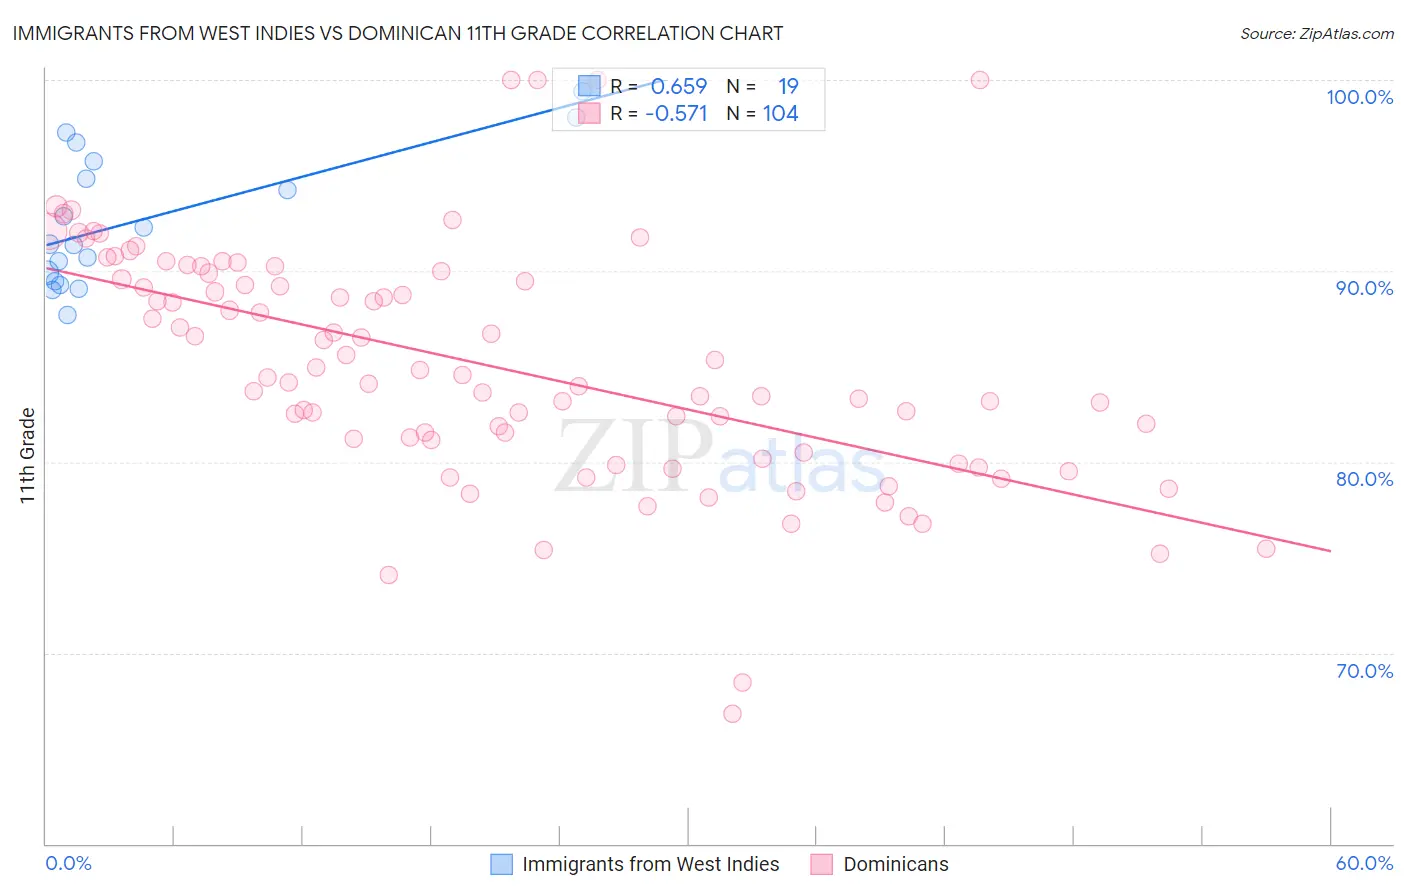
Immigrants from West Indies vs Dominican 11th Grade Correlation Chart
The statistical analysis conducted on geographies consisting of 72,457,514 people shows a significant positive correlation between the proportion of Immigrants from West Indies and percentage of population with at least 11th grade education in the United States with a correlation coefficient (R) of 0.659 and weighted average of 90.4%. Similarly, the statistical analysis conducted on geographies consisting of 355,142,452 people shows a substantial negative correlation between the proportion of Dominicans and percentage of population with at least 11th grade education in the United States with a correlation coefficient (R) of -0.571 and weighted average of 87.7%, a difference of 3.1%.
11th Grade Correlation Summary
| Measurement | Immigrants from West Indies | Dominican |
| Minimum | 87.7% | 66.8% |
| Maximum | 99.4% | 100.0% |
| Range | 11.7% | 33.2% |
| Mean | 92.6% | 85.1% |
| Median | 91.4% | 84.5% |
| Interquartile 25% (IQ1) | 89.5% | 80.8% |
| Interquartile 75% (IQ3) | 95.8% | 89.7% |
| Interquartile Range (IQR) | 6.3% | 8.9% |
| Standard Deviation (Sample) | 3.5% | 6.2% |
| Standard Deviation (Population) | 3.4% | 6.2% |
Similar Demographics by 11th Grade
Demographics Similar to Immigrants from West Indies by 11th Grade
In terms of 11th grade, the demographic groups most similar to Immigrants from West Indies are Apache (90.4%, a difference of 0.010%), Pennsylvania German (90.3%, a difference of 0.030%), Immigrants from Burma/Myanmar (90.4%, a difference of 0.050%), British West Indian (90.3%, a difference of 0.050%), and Indonesian (90.3%, a difference of 0.080%).
| Demographics | Rating | Rank | 11th Grade |
| Barbadians | 0.0 /100 | #279 | Tragic 90.8% |
| Sri Lankans | 0.0 /100 | #280 | Tragic 90.7% |
| Dutch West Indians | 0.0 /100 | #281 | Tragic 90.7% |
| Immigrants | St. Vincent and the Grenadines | 0.0 /100 | #282 | Tragic 90.7% |
| Immigrants | Barbados | 0.0 /100 | #283 | Tragic 90.7% |
| Immigrants | Laos | 0.0 /100 | #284 | Tragic 90.5% |
| Immigrants | Burma/Myanmar | 0.0 /100 | #285 | Tragic 90.4% |
| Immigrants | West Indies | 0.0 /100 | #286 | Tragic 90.4% |
| Apache | 0.0 /100 | #287 | Tragic 90.4% |
| Pennsylvania Germans | 0.0 /100 | #288 | Tragic 90.3% |
| British West Indians | 0.0 /100 | #289 | Tragic 90.3% |
| Indonesians | 0.0 /100 | #290 | Tragic 90.3% |
| Haitians | 0.0 /100 | #291 | Tragic 90.3% |
| Cubans | 0.0 /100 | #292 | Tragic 90.2% |
| Natives/Alaskans | 0.0 /100 | #293 | Tragic 90.2% |
Demographics Similar to Dominicans by 11th Grade
In terms of 11th grade, the demographic groups most similar to Dominicans are Immigrants from Cabo Verde (87.6%, a difference of 0.020%), Tohono O'odham (87.6%, a difference of 0.080%), Mexican American Indian (87.5%, a difference of 0.15%), Honduran (87.4%, a difference of 0.34%), and Hispanic or Latino (87.3%, a difference of 0.40%).
| Demographics | Rating | Rank | 11th Grade |
| Belizeans | 0.0 /100 | #319 | Tragic 88.8% |
| Immigrants | Armenia | 0.0 /100 | #320 | Tragic 88.8% |
| Immigrants | Belize | 0.0 /100 | #321 | Tragic 88.7% |
| Puerto Ricans | 0.0 /100 | #322 | Tragic 88.4% |
| Pima | 0.0 /100 | #323 | Tragic 88.3% |
| Central American Indians | 0.0 /100 | #324 | Tragic 88.2% |
| Immigrants | Nicaragua | 0.0 /100 | #325 | Tragic 88.1% |
| Dominicans | 0.0 /100 | #326 | Tragic 87.7% |
| Immigrants | Cabo Verde | 0.0 /100 | #327 | Tragic 87.6% |
| Tohono O'odham | 0.0 /100 | #328 | Tragic 87.6% |
| Mexican American Indians | 0.0 /100 | #329 | Tragic 87.5% |
| Hondurans | 0.0 /100 | #330 | Tragic 87.4% |
| Hispanics or Latinos | 0.0 /100 | #331 | Tragic 87.3% |
| Immigrants | Azores | 0.0 /100 | #332 | Tragic 87.2% |
| Immigrants | Yemen | 0.0 /100 | #333 | Tragic 87.1% |