Immigrants from Vietnam vs Chickasaw 7th Grade
COMPARE
Immigrants from Vietnam
Chickasaw
7th Grade
7th Grade Comparison
Immigrants from Vietnam
Chickasaw
93.9%
7TH GRADE
0.0/ 100
METRIC RATING
316th/ 347
METRIC RANK
96.7%
7TH GRADE
99.2/ 100
METRIC RATING
82nd/ 347
METRIC RANK
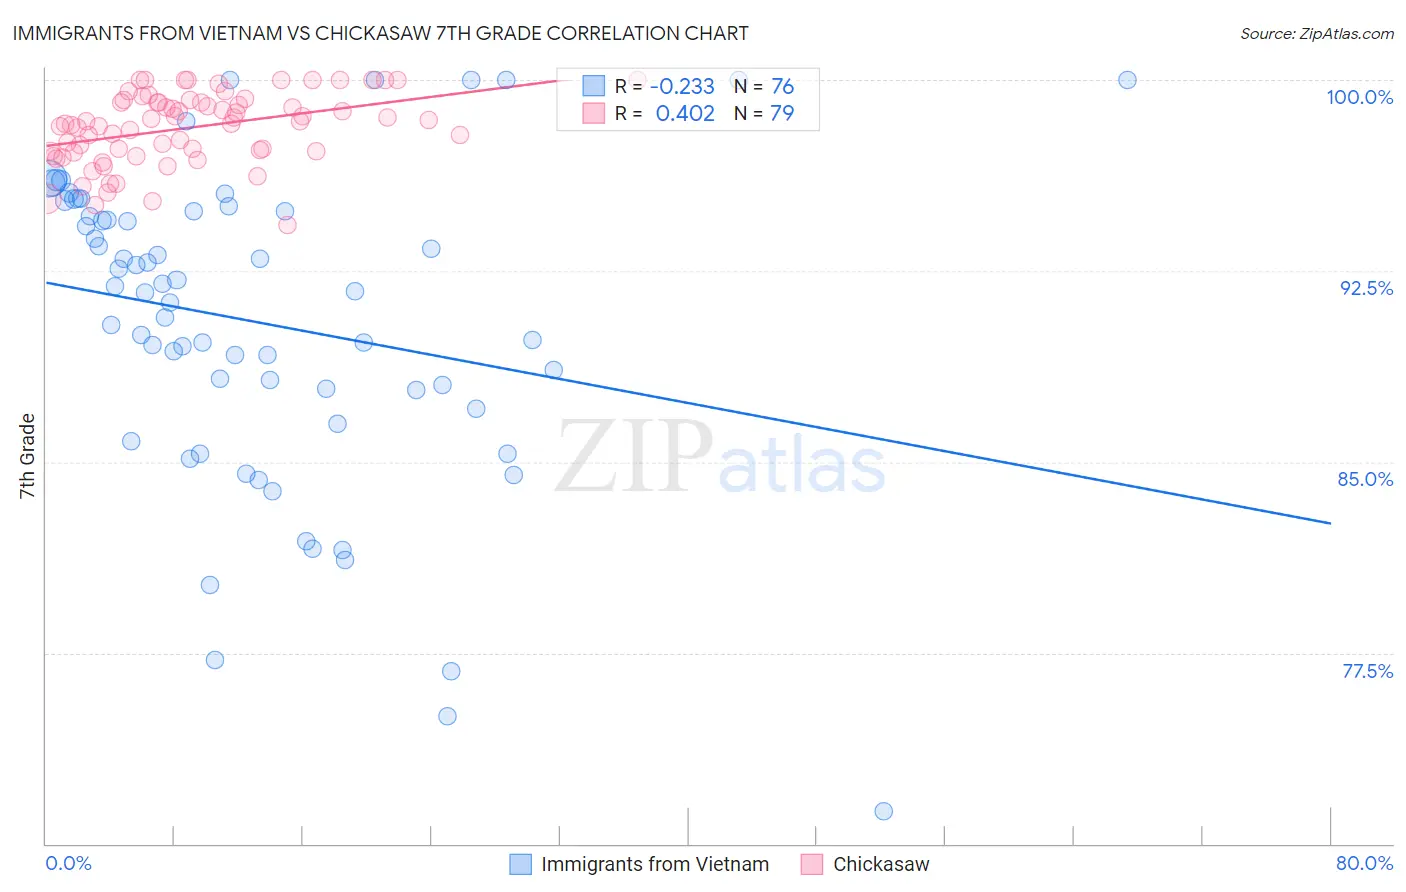
Immigrants from Vietnam vs Chickasaw 7th Grade Correlation Chart
The statistical analysis conducted on geographies consisting of 404,844,322 people shows a weak negative correlation between the proportion of Immigrants from Vietnam and percentage of population with at least 7th grade education in the United States with a correlation coefficient (R) of -0.233 and weighted average of 93.9%. Similarly, the statistical analysis conducted on geographies consisting of 147,726,545 people shows a moderate positive correlation between the proportion of Chickasaw and percentage of population with at least 7th grade education in the United States with a correlation coefficient (R) of 0.402 and weighted average of 96.7%, a difference of 3.0%.
7th Grade Correlation Summary
| Measurement | Immigrants from Vietnam | Chickasaw |
| Minimum | 71.3% | 94.3% |
| Maximum | 100.0% | 100.0% |
| Range | 28.7% | 5.7% |
| Mean | 90.5% | 98.1% |
| Median | 91.7% | 98.4% |
| Interquartile 25% (IQ1) | 87.5% | 97.2% |
| Interquartile 75% (IQ3) | 94.9% | 99.1% |
| Interquartile Range (IQR) | 7.4% | 1.9% |
| Standard Deviation (Sample) | 6.1% | 1.4% |
| Standard Deviation (Population) | 6.1% | 1.4% |
Similar Demographics by 7th Grade
Demographics Similar to Immigrants from Vietnam by 7th Grade
In terms of 7th grade, the demographic groups most similar to Immigrants from Vietnam are Vietnamese (93.9%, a difference of 0.030%), Japanese (94.0%, a difference of 0.080%), Immigrants from Cuba (93.8%, a difference of 0.090%), Immigrants (94.0%, a difference of 0.11%), and Immigrants from Bangladesh (94.0%, a difference of 0.11%).
| Demographics | Rating | Rank | 7th Grade |
| Ecuadorians | 0.0 /100 | #309 | Tragic 94.0% |
| Immigrants | Caribbean | 0.0 /100 | #310 | Tragic 94.0% |
| Puerto Ricans | 0.0 /100 | #311 | Tragic 94.0% |
| Immigrants | Immigrants | 0.0 /100 | #312 | Tragic 94.0% |
| Immigrants | Bangladesh | 0.0 /100 | #313 | Tragic 94.0% |
| Japanese | 0.0 /100 | #314 | Tragic 94.0% |
| Vietnamese | 0.0 /100 | #315 | Tragic 93.9% |
| Immigrants | Vietnam | 0.0 /100 | #316 | Tragic 93.9% |
| Immigrants | Cuba | 0.0 /100 | #317 | Tragic 93.8% |
| Immigrants | Ecuador | 0.0 /100 | #318 | Tragic 93.7% |
| Immigrants | Cambodia | 0.0 /100 | #319 | Tragic 93.7% |
| Immigrants | Fiji | 0.0 /100 | #320 | Tragic 93.5% |
| Belizeans | 0.0 /100 | #321 | Tragic 93.5% |
| Nicaraguans | 0.0 /100 | #322 | Tragic 93.5% |
| Immigrants | Belize | 0.0 /100 | #323 | Tragic 93.4% |
Demographics Similar to Chickasaw by 7th Grade
In terms of 7th grade, the demographic groups most similar to Chickasaw are Delaware (96.8%, a difference of 0.010%), Icelander (96.7%, a difference of 0.010%), Romanian (96.7%, a difference of 0.010%), Kiowa (96.7%, a difference of 0.010%), and Turkish (96.7%, a difference of 0.020%).
| Demographics | Rating | Rank | 7th Grade |
| Zimbabweans | 99.5 /100 | #75 | Exceptional 96.8% |
| Immigrants | Ireland | 99.4 /100 | #76 | Exceptional 96.8% |
| Cherokee | 99.4 /100 | #77 | Exceptional 96.8% |
| Immigrants | Netherlands | 99.3 /100 | #78 | Exceptional 96.8% |
| Cypriots | 99.3 /100 | #79 | Exceptional 96.8% |
| Yugoslavians | 99.3 /100 | #80 | Exceptional 96.8% |
| Delaware | 99.2 /100 | #81 | Exceptional 96.8% |
| Chickasaw | 99.2 /100 | #82 | Exceptional 96.7% |
| Icelanders | 99.1 /100 | #83 | Exceptional 96.7% |
| Romanians | 99.1 /100 | #84 | Exceptional 96.7% |
| Kiowa | 99.1 /100 | #85 | Exceptional 96.7% |
| Turks | 99.1 /100 | #86 | Exceptional 96.7% |
| Immigrants | Belgium | 99.0 /100 | #87 | Exceptional 96.7% |
| Puget Sound Salish | 99.0 /100 | #88 | Exceptional 96.7% |
| Cree | 99.0 /100 | #89 | Exceptional 96.7% |