Immigrants from Venezuela vs Crow 11th Grade
COMPARE
Immigrants from Venezuela
Crow
11th Grade
11th Grade Comparison
Immigrants from Venezuela
Crow
92.7%
11TH GRADE
72.0/ 100
METRIC RATING
158th/ 347
METRIC RANK
92.9%
11TH GRADE
84.1/ 100
METRIC RATING
139th/ 347
METRIC RANK
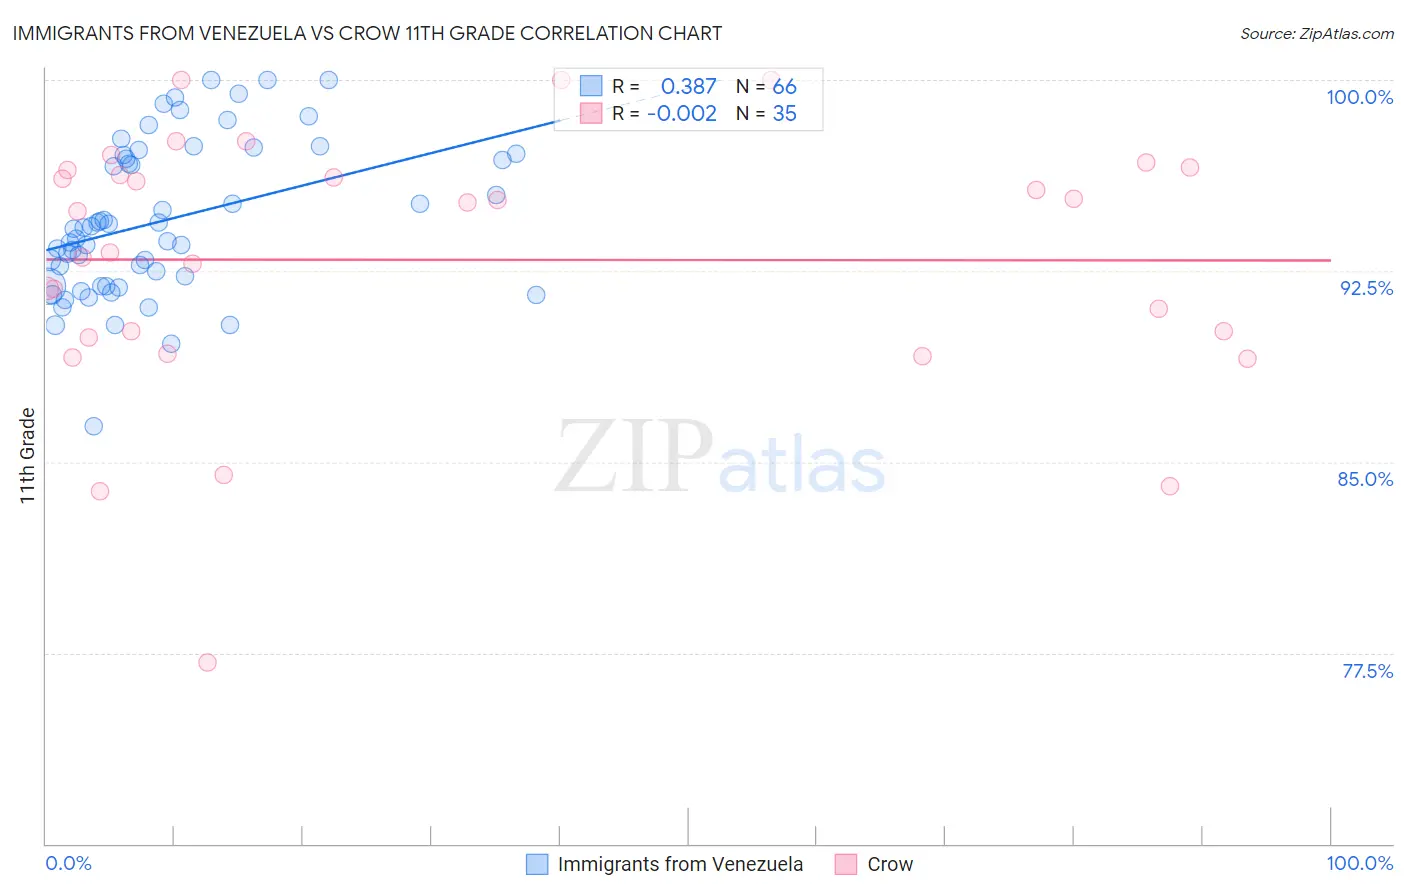
Immigrants from Venezuela vs Crow 11th Grade Correlation Chart
The statistical analysis conducted on geographies consisting of 287,866,258 people shows a mild positive correlation between the proportion of Immigrants from Venezuela and percentage of population with at least 11th grade education in the United States with a correlation coefficient (R) of 0.387 and weighted average of 92.7%. Similarly, the statistical analysis conducted on geographies consisting of 59,209,940 people shows no correlation between the proportion of Crow and percentage of population with at least 11th grade education in the United States with a correlation coefficient (R) of -0.002 and weighted average of 92.9%, a difference of 0.18%.
11th Grade Correlation Summary
| Measurement | Immigrants from Venezuela | Crow |
| Minimum | 86.4% | 77.1% |
| Maximum | 100.0% | 100.0% |
| Range | 13.6% | 22.9% |
| Mean | 94.5% | 92.9% |
| Median | 94.2% | 94.9% |
| Interquartile 25% (IQ1) | 91.9% | 89.9% |
| Interquartile 75% (IQ3) | 97.0% | 96.5% |
| Interquartile Range (IQR) | 5.1% | 6.6% |
| Standard Deviation (Sample) | 3.0% | 5.1% |
| Standard Deviation (Population) | 3.0% | 5.0% |
Demographics Similar to Immigrants from Venezuela and Crow by 11th Grade
In terms of 11th grade, the demographic groups most similar to Immigrants from Venezuela are Immigrants from Spain (92.7%, a difference of 0.010%), Immigrants from Eastern Asia (92.7%, a difference of 0.010%), Brazilian (92.8%, a difference of 0.020%), Osage (92.7%, a difference of 0.020%), and Argentinean (92.7%, a difference of 0.020%). Similarly, the demographic groups most similar to Crow are Venezuelan (92.9%, a difference of 0.010%), Immigrants from Brazil (92.9%, a difference of 0.020%), Chilean (92.9%, a difference of 0.020%), Kenyan (92.9%, a difference of 0.040%), and Ugandan (92.9%, a difference of 0.050%).
| Demographics | Rating | Rank | 11th Grade |
| Immigrants | Brazil | 85.1 /100 | #138 | Excellent 92.9% |
| Crow | 84.1 /100 | #139 | Excellent 92.9% |
| Venezuelans | 83.4 /100 | #140 | Excellent 92.9% |
| Chileans | 83.0 /100 | #141 | Excellent 92.9% |
| Kenyans | 82.0 /100 | #142 | Excellent 92.9% |
| Ugandans | 81.4 /100 | #143 | Excellent 92.9% |
| Assyrians/Chaldeans/Syriacs | 80.5 /100 | #144 | Excellent 92.8% |
| Pakistanis | 79.6 /100 | #145 | Good 92.8% |
| Iroquois | 79.1 /100 | #146 | Good 92.8% |
| Immigrants | Kenya | 78.7 /100 | #147 | Good 92.8% |
| Hmong | 78.6 /100 | #148 | Good 92.8% |
| Immigrants | Poland | 78.5 /100 | #149 | Good 92.8% |
| Immigrants | Egypt | 77.5 /100 | #150 | Good 92.8% |
| Potawatomi | 74.3 /100 | #151 | Good 92.8% |
| Iraqis | 74.2 /100 | #152 | Good 92.8% |
| Brazilians | 73.9 /100 | #153 | Good 92.8% |
| Osage | 73.4 /100 | #154 | Good 92.7% |
| Argentineans | 73.4 /100 | #155 | Good 92.7% |
| Immigrants | Spain | 73.0 /100 | #156 | Good 92.7% |
| Immigrants | Eastern Asia | 72.6 /100 | #157 | Good 92.7% |
| Immigrants | Venezuela | 72.0 /100 | #158 | Good 92.7% |