Immigrants from Venezuela vs Blackfeet 1st Grade

COMPARE

Immigrants from Venezuela
Race
Ancestry
AfghanAfricanAlaska NativeAlaskan AthabascanAlbanianAleutAlsatianAmericanApacheArabArapahoArgentineanArmenianAssyrian/Chaldean/SyriacAustralianAustrianBahamianBangladeshiBarbadianBasqueBelgianBelizeanBermudanBhutaneseBolivianBrazilianBritishBritish West IndianBulgarianBurmeseCajunCambodianCanadianCape VerdeanCarpatho RusynCelticCentral AmericanCentral American IndianCherokeeCheyenneChickasawChileanChineseChippewaChoctawColombianColvilleComancheCosta RicanCreeCreekCroatianCrowCubanCypriotCzechCzechoslovakianDanishDelawareDominicanDutchDutch West IndianEastern EuropeanEcuadorianEgyptianEnglishEstonianEthiopianEuropeanFijianFilipinoFinnishFrenchFrench American IndianFrench CanadianGermanGerman RussianGhanaianGreekGuamanian/ChamorroGuatemalanGuyaneseHaitianHmongHonduranHopiHoumaHungarianIcelanderIndian (Asian)IndonesianInupiatIranianIraqiIrishIroquoisIsraeliItalianJamaicanJapaneseJordanianKenyanKiowaKoreanLaotianLatvianLebaneseLiberianLithuanianLumbeeLuxembourgerMacedonianMalaysianMalteseMarshalleseMenomineeMexicanMexican American IndianMongolianMoroccanNative HawaiianNavajoNepaleseNew ZealanderNicaraguanNigerianNorthern EuropeanNorwegianOkinawanOsageOttawaPaiutePakistaniPalestinianPanamanianParaguayanPennsylvania GermanPeruvianPimaPolishPortuguesePotawatomiPuebloPuerto RicanPuget Sound SalishRomanianRussianSalvadoranSamoanScandinavianScotch-IrishScottishSeminoleSenegaleseSerbianShoshoneSierra LeoneanSiouxSlavicSlovakSloveneSomaliSouth AfricanSouth AmericanSouth American IndianSoviet UnionSpaniardSpanishSpanish AmericanSpanish American IndianSri LankanSubsaharan AfricanSudaneseSwedishSwissSyrianTaiwaneseThaiTlingit-HaidaTohono O'OdhamTonganTrinidadian and TobagonianTsimshianTurkishU.S. Virgin IslanderUgandanUkrainianUruguayanUteVenezuelanVietnameseWelshWest IndianYakamaYaquiYugoslavianYumanYup'ikZimbabwean
Immigration
NonimmigrantsImmigrantsAfghanistanAfricaAlbaniaArgentinaArmeniaAsiaAustraliaAustriaBahamasBangladeshBarbadosBelarusBelgiumBelizeBoliviaBosnia and HerzegovinaBrazilBulgariaBurma/MyanmarCabo VerdeCambodiaCameroonCanadaCaribbeanCentral AmericaChileChinaColombiaCongoCosta RicaCroatiaCubaCzechoslovakiaDenmarkDominicaDominican RepublicEastern AfricaEastern AsiaEastern EuropeEcuadorEgyptEl SalvadorEnglandEritreaEthiopiaEuropeFijiFranceGermanyGhanaGreeceGrenadaGuatemalaGuyanaHaitiHondurasHong KongHungaryIndiaIndonesiaIranIraqIrelandIsraelItalyJamaicaJapanJordanKazakhstanKenyaKoreaKuwaitLaosLatin AmericaLatviaLebanonLiberiaLithuaniaMalaysiaMexicoMicronesiaMiddle AfricaMoldovaMoroccoNepalNetherlandsNicaraguaNigeriaNorth AmericaNorth MacedoniaNorthern AfricaNorthern EuropeNorwayOceaniaPakistanPanamaPeruPhilippinesPolandPortugalRomaniaRussiaSaudi ArabiaScotlandSenegalSerbiaSierra LeoneSingaporeSomaliaSouth AfricaSouth AmericaSouth Central AsiaSouth Eastern AsiaSouthern EuropeSpainSri LankaSt. Vincent and the GrenadinesSudanSwedenSwitzerlandSyriaTaiwanThailandTrinidad and TobagoTurkeyUgandaUkraineUruguayUzbekistanVenezuelaVietnamWest IndiesWestern AfricaWestern AsiaWestern EuropeYemenZaireZimbabweAzores
Blackfeet
Race
Ancestry
AfghanAfricanAlaska NativeAlaskan AthabascanAlbanianAleutAlsatianAmericanApacheArabArapahoArgentineanArmenianAssyrian/Chaldean/SyriacAustralianAustrianBahamianBangladeshiBarbadianBasqueBelgianBelizeanBermudanBhutaneseBlackfeetBolivianBrazilianBritishBritish West IndianBulgarianBurmeseCajunCambodianCanadianCape VerdeanCarpatho RusynCelticCentral AmericanCentral American IndianCherokeeCheyenneChickasawChileanChineseChippewaChoctawColombianColvilleComancheCosta RicanCreeCreekCroatianCrowCubanCypriotCzechCzechoslovakianDanishDelawareDominicanDutchDutch West IndianEastern EuropeanEcuadorianEgyptianEnglishEstonianEthiopianEuropeanFijianFilipinoFinnishFrenchFrench American IndianFrench CanadianGermanGerman RussianGhanaianGreekGuamanian/ChamorroGuatemalanGuyaneseHaitianHmongHonduranHopiHoumaHungarianIcelanderIndian (Asian)IndonesianInupiatIranianIraqiIrishIroquoisIsraeliItalianJamaicanJapaneseJordanianKenyanKiowaKoreanLaotianLatvianLebaneseLiberianLithuanianLumbeeLuxembourgerMacedonianMalaysianMalteseMarshalleseMenomineeMexicanMexican American IndianMongolianMoroccanNative HawaiianNavajoNepaleseNew ZealanderNicaraguanNigerianNorthern EuropeanNorwegianOkinawanOsageOttawaPaiutePakistaniPalestinianPanamanianParaguayanPennsylvania GermanPeruvianPimaPolishPortuguesePotawatomiPuebloPuerto RicanPuget Sound SalishRomanianRussianSalvadoranSamoanScandinavianScotch-IrishScottishSeminoleSenegaleseSerbianShoshoneSierra LeoneanSiouxSlavicSlovakSloveneSomaliSouth AfricanSouth AmericanSouth American IndianSoviet UnionSpaniardSpanishSpanish AmericanSpanish American IndianSri LankanSubsaharan AfricanSudaneseSwedishSwissSyrianTaiwaneseThaiTlingit-HaidaTohono O'OdhamTonganTrinidadian and TobagonianTsimshianTurkishU.S. Virgin IslanderUgandanUkrainianUruguayanUteVenezuelanVietnameseWelshWest IndianYakamaYaquiYugoslavianYumanYup'ikZimbabwean
Immigration
NonimmigrantsImmigrantsAfghanistanAfricaAlbaniaArgentinaArmeniaAsiaAustraliaAustriaBahamasBangladeshBarbadosBelarusBelgiumBelizeBoliviaBosnia and HerzegovinaBrazilBulgariaBurma/MyanmarCabo VerdeCambodiaCameroonCanadaCaribbeanCentral AmericaChileChinaColombiaCongoCosta RicaCroatiaCubaCzechoslovakiaDenmarkDominicaDominican RepublicEastern AfricaEastern AsiaEastern EuropeEcuadorEgyptEl SalvadorEnglandEritreaEthiopiaEuropeFijiFranceGermanyGhanaGreeceGrenadaGuatemalaGuyanaHaitiHondurasHong KongHungaryIndiaIndonesiaIranIraqIrelandIsraelItalyJamaicaJapanJordanKazakhstanKenyaKoreaKuwaitLaosLatin AmericaLatviaLebanonLiberiaLithuaniaMalaysiaMexicoMicronesiaMiddle AfricaMoldovaMoroccoNepalNetherlandsNicaraguaNigeriaNorth AmericaNorth MacedoniaNorthern AfricaNorthern EuropeNorwayOceaniaPakistanPanamaPeruPhilippinesPolandPortugalRomaniaRussiaSaudi ArabiaScotlandSenegalSerbiaSierra LeoneSingaporeSomaliaSouth AfricaSouth AmericaSouth Central AsiaSouth Eastern AsiaSouthern EuropeSpainSri LankaSt. Vincent and the GrenadinesSudanSwedenSwitzerlandSyriaTaiwanThailandTrinidad and TobagoTurkeyUgandaUkraineUruguayUzbekistanVietnamWest IndiesWestern AfricaWestern AsiaWestern EuropeYemenZaireZimbabweAzores
1st Grade
Income
Poverty
Unemployment
Labor Participation
Family Structure
Vehicle Availability
Education Level
Disability

1st Grade Comparison

Immigrants from Venezuela

Blackfeet

Average
Excellent
97.9%
1ST GRADE
47.8/ 100
METRIC RATING
178th/ 347
METRIC RANK
98.1%
1ST GRADE
87.6/ 100
METRIC RATING
139th/ 347
METRIC RANK

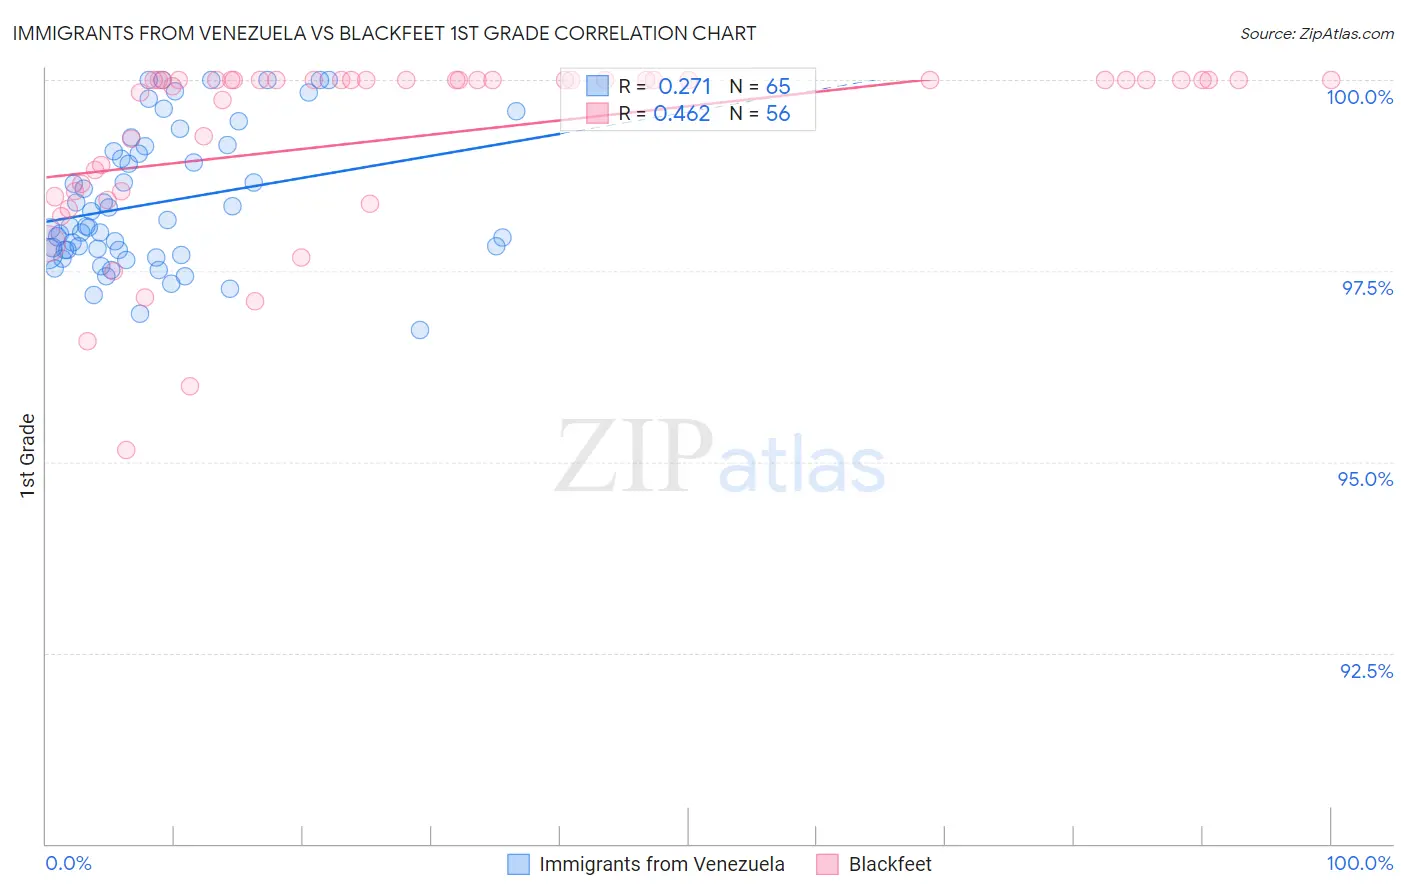
Immigrants from Venezuela vs Blackfeet 1st Grade Correlation Chart

The statistical analysis conducted on geographies consisting of 287,866,009 people shows a weak positive correlation between the proportion of Immigrants from Venezuela and percentage of population with at least 1st grade education in the United States with a correlation coefficient (R) of 0.271 and weighted average of 97.9%. Similarly, the statistical analysis conducted on geographies consisting of 309,580,957 people shows a moderate positive correlation between the proportion of Blackfeet and percentage of population with at least 1st grade education in the United States with a correlation coefficient (R) of 0.462 and weighted average of 98.1%, a difference of 0.16%.
Immigrants from Venezuela vs Blackfeet 1st Grade

1st Grade Correlation Summary

MeasurementImmigrants from VenezuelaBlackfeet
Minimum96.7%95.2%
Maximum100.0%100.0%
Range3.3%4.8%
Mean98.4%99.3%
Median98.1%100.0%
Interquartile 25% (IQ1)97.7%98.5%
Interquartile 75% (IQ3)99.1%100.0%
Interquartile Range (IQR)1.4%1.5%
Standard Deviation (Sample)0.89%1.2%
Standard Deviation (Population)0.88%1.2%

Similar Demographics by 1st Grade

Demographics Similar to Immigrants from Venezuela by 1st Grade

In terms of 1st grade, the demographic groups most similar to Immigrants from Venezuela are Immigrants from Brazil (97.9%, a difference of 0.0%), Argentinean (97.9%, a difference of 0.0%), Immigrants from Bosnia and Herzegovina (97.9%, a difference of 0.0%), Kenyan (97.9%, a difference of 0.010%), and Native/Alaskan (97.9%, a difference of 0.010%).
DemographicsRating | Rank1st Grade
Immigrants | Jordan
53.9
/100
|
#171
Average
97.9%
Immigrants | Korea
53.0
/100
|
#172
Average
97.9%
Kenyans
51.2
/100
|
#173
Average
97.9%
Natives/Alaskans
50.0
/100
|
#174
Average
97.9%
Immigrants | Sri Lanka
49.7
/100
|
#175
Average
97.9%
Albanians
49.6
/100
|
#176
Average
97.9%
Immigrants | Brazil
49.1
/100
|
#177
Average
97.9%
Immigrants | Venezuela
47.8
/100
|
#178
Average
97.9%
Argentineans
47.2
/100
|
#179
Average
97.9%
Immigrants | Bosnia and Herzegovina
46.6
/100
|
#180
Average
97.9%
Portuguese
44.2
/100
|
#181
Average
97.9%
Egyptians
42.7
/100
|
#182
Average
97.9%
Immigrants | Argentina
41.3
/100
|
#183
Average
97.9%
Immigrants | Poland
40.1
/100
|
#184
Average
97.9%
Immigrants | Belarus
39.3
/100
|
#185
Fair
97.9%

Demographics Similar to Blackfeet by 1st Grade

In terms of 1st grade, the demographic groups most similar to Blackfeet are Israeli (98.1%, a difference of 0.0%), Immigrants from Romania (98.1%, a difference of 0.0%), Immigrants from Hungary (98.1%, a difference of 0.010%), Immigrants from Kuwait (98.1%, a difference of 0.010%), and Immigrants from Bulgaria (98.1%, a difference of 0.010%).
DemographicsRating | Rank1st Grade
Cambodians
90.9
/100
|
#132
Exceptional
98.1%
Immigrants | Europe
90.5
/100
|
#133
Exceptional
98.1%
Immigrants | Hungary
89.4
/100
|
#134
Excellent
98.1%
Immigrants | Kuwait
89.3
/100
|
#135
Excellent
98.1%
Immigrants | Bulgaria
88.8
/100
|
#136
Excellent
98.1%
Israelis
87.8
/100
|
#137
Excellent
98.1%
Immigrants | Romania
87.8
/100
|
#138
Excellent
98.1%
Blackfeet
87.6
/100
|
#139
Excellent
98.1%
Palestinians
83.0
/100
|
#140
Excellent
98.0%
Immigrants | Turkey
82.8
/100
|
#141
Excellent
98.0%
Marshallese
82.0
/100
|
#142
Excellent
98.0%
Burmese
81.0
/100
|
#143
Excellent
98.0%
Alsatians
80.9
/100
|
#144
Excellent
98.0%
Hmong
79.0
/100
|
#145
Good
98.0%
Immigrants | Israel
77.8
/100
|
#146
Good
98.0%