Immigrants from Uzbekistan vs Yup'ik No Schooling Completed
COMPARE
Immigrants from Uzbekistan
Yup'ik
No Schooling Completed
No Schooling Completed Comparison
Immigrants from Uzbekistan
Yup'ik
2.6%
NO SCHOOLING COMPLETED
0.1/ 100
METRIC RATING
278th/ 347
METRIC RANK
1.2%
NO SCHOOLING COMPLETED
100.0/ 100
METRIC RATING
1st/ 347
METRIC RANK
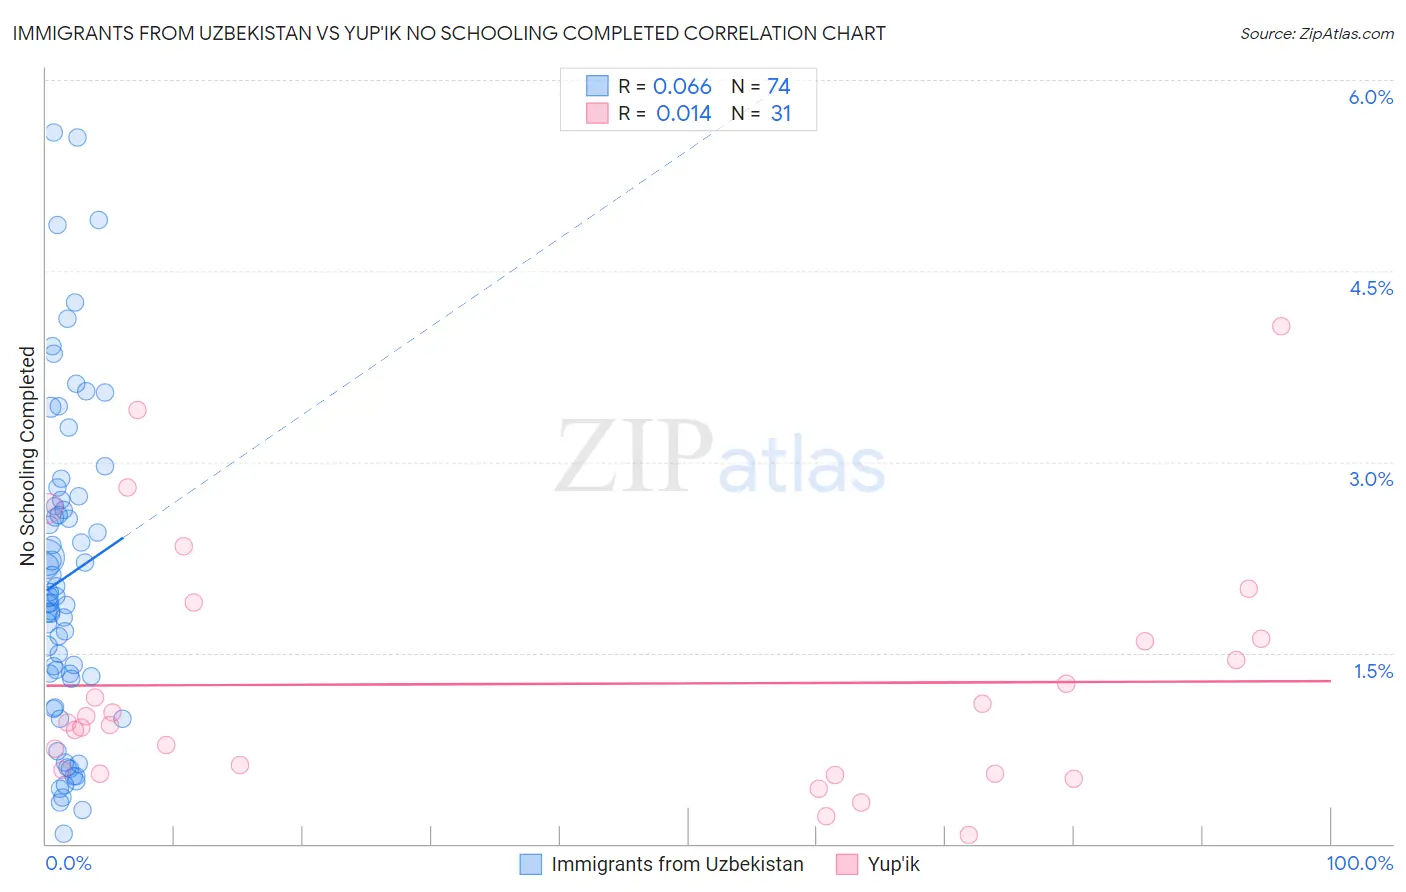
Immigrants from Uzbekistan vs Yup'ik No Schooling Completed Correlation Chart
The statistical analysis conducted on geographies consisting of 118,288,407 people shows a slight positive correlation between the proportion of Immigrants from Uzbekistan and percentage of population with no schooling in the United States with a correlation coefficient (R) of 0.066 and weighted average of 2.6%. Similarly, the statistical analysis conducted on geographies consisting of 39,712,568 people shows no correlation between the proportion of Yup'ik and percentage of population with no schooling in the United States with a correlation coefficient (R) of 0.014 and weighted average of 1.2%, a difference of 110.0%.
No Schooling Completed Correlation Summary
| Measurement | Immigrants from Uzbekistan | Yup'ik |
| Minimum | 0.076% | 0.071% |
| Maximum | 5.6% | 4.1% |
| Range | 5.5% | 4.0% |
| Mean | 2.1% | 1.3% |
| Median | 1.9% | 0.95% |
| Interquartile 25% (IQ1) | 1.3% | 0.55% |
| Interquartile 75% (IQ3) | 2.7% | 1.6% |
| Interquartile Range (IQR) | 1.4% | 1.1% |
| Standard Deviation (Sample) | 1.3% | 0.95% |
| Standard Deviation (Population) | 1.3% | 0.94% |
Similar Demographics by No Schooling Completed
Demographics Similar to Immigrants from Uzbekistan by No Schooling Completed
In terms of no schooling completed, the demographic groups most similar to Immigrants from Uzbekistan are Immigrants from Philippines (2.6%, a difference of 0.20%), Immigrants from Western Africa (2.6%, a difference of 0.25%), Barbadian (2.6%, a difference of 0.55%), Trinidadian and Tobagonian (2.6%, a difference of 0.56%), and Afghan (2.6%, a difference of 0.64%).
| Demographics | Rating | Rank | No Schooling Completed |
| Cubans | 0.2 /100 | #271 | Tragic 2.5% |
| Immigrants | Bolivia | 0.2 /100 | #272 | Tragic 2.5% |
| Immigrants | Cameroon | 0.1 /100 | #273 | Tragic 2.5% |
| Ghanaians | 0.1 /100 | #274 | Tragic 2.6% |
| Immigrants | China | 0.1 /100 | #275 | Tragic 2.6% |
| Immigrants | Western Africa | 0.1 /100 | #276 | Tragic 2.6% |
| Immigrants | Philippines | 0.1 /100 | #277 | Tragic 2.6% |
| Immigrants | Uzbekistan | 0.1 /100 | #278 | Tragic 2.6% |
| Barbadians | 0.1 /100 | #279 | Tragic 2.6% |
| Trinidadians and Tobagonians | 0.1 /100 | #280 | Tragic 2.6% |
| Afghans | 0.1 /100 | #281 | Tragic 2.6% |
| Immigrants | Ghana | 0.1 /100 | #282 | Tragic 2.6% |
| Immigrants | Trinidad and Tobago | 0.0 /100 | #283 | Tragic 2.6% |
| Immigrants | West Indies | 0.0 /100 | #284 | Tragic 2.7% |
| Immigrants | Barbados | 0.0 /100 | #285 | Tragic 2.7% |
Demographics Similar to Yup'ik by No Schooling Completed
In terms of no schooling completed, the demographic groups most similar to Yup'ik are Slovak (1.3%, a difference of 9.1%), Norwegian (1.3%, a difference of 9.6%), German (1.4%, a difference of 10.2%), Slovene (1.4%, a difference of 10.7%), and Carpatho Rusyn (1.4%, a difference of 11.6%).
| Demographics | Rating | Rank | No Schooling Completed |
| Yup'ik | 100.0 /100 | #1 | Exceptional 1.2% |
| Slovaks | 100.0 /100 | #2 | Exceptional 1.3% |
| Norwegians | 100.0 /100 | #3 | Exceptional 1.3% |
| Germans | 100.0 /100 | #4 | Exceptional 1.4% |
| Slovenes | 100.0 /100 | #5 | Exceptional 1.4% |
| Carpatho Rusyns | 100.0 /100 | #6 | Exceptional 1.4% |
| English | 100.0 /100 | #7 | Exceptional 1.4% |
| Swedes | 100.0 /100 | #8 | Exceptional 1.4% |
| Scottish | 100.0 /100 | #9 | Exceptional 1.4% |
| Dutch | 100.0 /100 | #10 | Exceptional 1.4% |
| Lithuanians | 100.0 /100 | #11 | Exceptional 1.4% |
| Irish | 100.0 /100 | #12 | Exceptional 1.4% |
| Poles | 100.0 /100 | #13 | Exceptional 1.4% |
| Scotch-Irish | 100.0 /100 | #14 | Exceptional 1.5% |
| Tlingit-Haida | 100.0 /100 | #15 | Exceptional 1.5% |