Immigrants from Uzbekistan vs Immigrants from Nepal High School Diploma

COMPARE

Immigrants from Uzbekistan
Race
Ancestry
AfghanAfricanAlaska NativeAlaskan AthabascanAlbanianAleutAlsatianAmericanApacheArabArapahoArgentineanArmenianAssyrian/Chaldean/SyriacAustralianAustrianBahamianBangladeshiBarbadianBasqueBelgianBelizeanBermudanBhutaneseBlackfeetBolivianBrazilianBritishBritish West IndianBulgarianBurmeseCajunCambodianCanadianCape VerdeanCarpatho RusynCelticCentral AmericanCentral American IndianCherokeeCheyenneChickasawChileanChineseChippewaChoctawColombianColvilleComancheCosta RicanCreeCreekCroatianCrowCubanCypriotCzechCzechoslovakianDanishDelawareDominicanDutchDutch West IndianEastern EuropeanEcuadorianEgyptianEnglishEstonianEthiopianEuropeanFijianFilipinoFinnishFrenchFrench American IndianFrench CanadianGermanGerman RussianGhanaianGreekGuamanian/ChamorroGuatemalanGuyaneseHaitianHmongHonduranHopiHoumaHungarianIcelanderIndian (Asian)IndonesianInupiatIranianIraqiIrishIroquoisIsraeliItalianJamaicanJapaneseJordanianKenyanKiowaKoreanLaotianLatvianLebaneseLiberianLithuanianLumbeeLuxembourgerMacedonianMalaysianMalteseMarshalleseMenomineeMexicanMexican American IndianMongolianMoroccanNative HawaiianNavajoNepaleseNew ZealanderNicaraguanNigerianNorthern EuropeanNorwegianOkinawanOsageOttawaPaiutePakistaniPalestinianPanamanianParaguayanPennsylvania GermanPeruvianPimaPolishPortuguesePotawatomiPuebloPuerto RicanPuget Sound SalishRomanianRussianSalvadoranSamoanScandinavianScotch-IrishScottishSeminoleSenegaleseSerbianShoshoneSierra LeoneanSiouxSlavicSlovakSloveneSomaliSouth AfricanSouth AmericanSouth American IndianSoviet UnionSpaniardSpanishSpanish AmericanSpanish American IndianSri LankanSubsaharan AfricanSudaneseSwedishSwissSyrianTaiwaneseThaiTlingit-HaidaTohono O'OdhamTonganTrinidadian and TobagonianTsimshianTurkishU.S. Virgin IslanderUgandanUkrainianUruguayanUteVenezuelanVietnameseWelshWest IndianYakamaYaquiYugoslavianYumanYup'ikZimbabwean
Immigration
NonimmigrantsImmigrantsAfghanistanAfricaAlbaniaArgentinaArmeniaAsiaAustraliaAustriaBahamasBangladeshBarbadosBelarusBelgiumBelizeBoliviaBosnia and HerzegovinaBrazilBulgariaBurma/MyanmarCabo VerdeCambodiaCameroonCanadaCaribbeanCentral AmericaChileChinaColombiaCongoCosta RicaCroatiaCubaCzechoslovakiaDenmarkDominicaDominican RepublicEastern AfricaEastern AsiaEastern EuropeEcuadorEgyptEl SalvadorEnglandEritreaEthiopiaEuropeFijiFranceGermanyGhanaGreeceGrenadaGuatemalaGuyanaHaitiHondurasHong KongHungaryIndiaIndonesiaIranIraqIrelandIsraelItalyJamaicaJapanJordanKazakhstanKenyaKoreaKuwaitLaosLatin AmericaLatviaLebanonLiberiaLithuaniaMalaysiaMexicoMicronesiaMiddle AfricaMoldovaMoroccoNetherlandsNicaraguaNigeriaNorth AmericaNorth MacedoniaNorthern AfricaNorthern EuropeNorwayOceaniaPakistanPanamaPeruPhilippinesPolandPortugalRomaniaRussiaSaudi ArabiaScotlandSenegalSerbiaSierra LeoneSingaporeSomaliaSouth AfricaSouth AmericaSouth Central AsiaSouth Eastern AsiaSouthern EuropeSpainSri LankaSt. Vincent and the GrenadinesSudanSwedenSwitzerlandSyriaTaiwanThailandTrinidad and TobagoTurkeyUgandaUkraineUruguayUzbekistanVenezuelaVietnamWest IndiesWestern AfricaWestern AsiaWestern EuropeYemenZaireZimbabweAzores
Immigrants from Nepal
Race
Ancestry
AfghanAfricanAlaska NativeAlaskan AthabascanAlbanianAleutAlsatianAmericanApacheArabArapahoArgentineanArmenianAssyrian/Chaldean/SyriacAustralianAustrianBahamianBangladeshiBarbadianBasqueBelgianBelizeanBermudanBhutaneseBlackfeetBolivianBrazilianBritishBritish West IndianBulgarianBurmeseCajunCambodianCanadianCape VerdeanCarpatho RusynCelticCentral AmericanCentral American IndianCherokeeCheyenneChickasawChileanChineseChippewaChoctawColombianColvilleComancheCosta RicanCreeCreekCroatianCrowCubanCypriotCzechCzechoslovakianDanishDelawareDominicanDutchDutch West IndianEastern EuropeanEcuadorianEgyptianEnglishEstonianEthiopianEuropeanFijianFilipinoFinnishFrenchFrench American IndianFrench CanadianGermanGerman RussianGhanaianGreekGuamanian/ChamorroGuatemalanGuyaneseHaitianHmongHonduranHopiHoumaHungarianIcelanderIndian (Asian)IndonesianInupiatIranianIraqiIrishIroquoisIsraeliItalianJamaicanJapaneseJordanianKenyanKiowaKoreanLaotianLatvianLebaneseLiberianLithuanianLumbeeLuxembourgerMacedonianMalaysianMalteseMarshalleseMenomineeMexicanMexican American IndianMongolianMoroccanNative HawaiianNavajoNepaleseNew ZealanderNicaraguanNigerianNorthern EuropeanNorwegianOkinawanOsageOttawaPaiutePakistaniPalestinianPanamanianParaguayanPennsylvania GermanPeruvianPimaPolishPortuguesePotawatomiPuebloPuerto RicanPuget Sound SalishRomanianRussianSalvadoranSamoanScandinavianScotch-IrishScottishSeminoleSenegaleseSerbianShoshoneSierra LeoneanSiouxSlavicSlovakSloveneSomaliSouth AfricanSouth AmericanSouth American IndianSoviet UnionSpaniardSpanishSpanish AmericanSpanish American IndianSri LankanSubsaharan AfricanSudaneseSwedishSwissSyrianTaiwaneseThaiTlingit-HaidaTohono O'OdhamTonganTrinidadian and TobagonianTsimshianTurkishU.S. Virgin IslanderUgandanUkrainianUruguayanUteVenezuelanVietnameseWelshWest IndianYakamaYaquiYugoslavianYumanYup'ikZimbabwean
Immigration
NonimmigrantsImmigrantsAfghanistanAfricaAlbaniaArgentinaArmeniaAsiaAustraliaAustriaBahamasBangladeshBarbadosBelarusBelgiumBelizeBoliviaBosnia and HerzegovinaBrazilBulgariaBurma/MyanmarCabo VerdeCambodiaCameroonCanadaCaribbeanCentral AmericaChileChinaColombiaCongoCosta RicaCroatiaCubaCzechoslovakiaDenmarkDominicaDominican RepublicEastern AfricaEastern AsiaEastern EuropeEcuadorEgyptEl SalvadorEnglandEritreaEthiopiaEuropeFijiFranceGermanyGhanaGreeceGrenadaGuatemalaGuyanaHaitiHondurasHong KongHungaryIndiaIndonesiaIranIraqIrelandIsraelItalyJamaicaJapanJordanKazakhstanKenyaKoreaKuwaitLaosLatin AmericaLatviaLebanonLiberiaLithuaniaMalaysiaMexicoMicronesiaMiddle AfricaMoldovaMoroccoNepalNetherlandsNicaraguaNigeriaNorth AmericaNorth MacedoniaNorthern AfricaNorthern EuropeNorwayOceaniaPakistanPanamaPeruPhilippinesPolandPortugalRomaniaRussiaSaudi ArabiaScotlandSenegalSerbiaSierra LeoneSingaporeSomaliaSouth AfricaSouth AmericaSouth Central AsiaSouth Eastern AsiaSouthern EuropeSpainSri LankaSt. Vincent and the GrenadinesSudanSwedenSwitzerlandSyriaTaiwanThailandTrinidad and TobagoTurkeyUgandaUkraineUruguayVenezuelaVietnamWest IndiesWestern AfricaWestern AsiaWestern EuropeYemenZaireZimbabweAzores
High School Diploma
Income
Poverty
Unemployment
Labor Participation
Family Structure
Vehicle Availability
Education Level
Disability

High School Diploma Comparison

Immigrants from Uzbekistan

Immigrants from Nepal

Tragic
Good
87.8%
HIGH SCHOOL DIPLOMA
2.1/ 100
METRIC RATING
241st/ 347
METRIC RANK
89.3%
HIGH SCHOOL DIPLOMA
61.1/ 100
METRIC RATING
164th/ 347
METRIC RANK

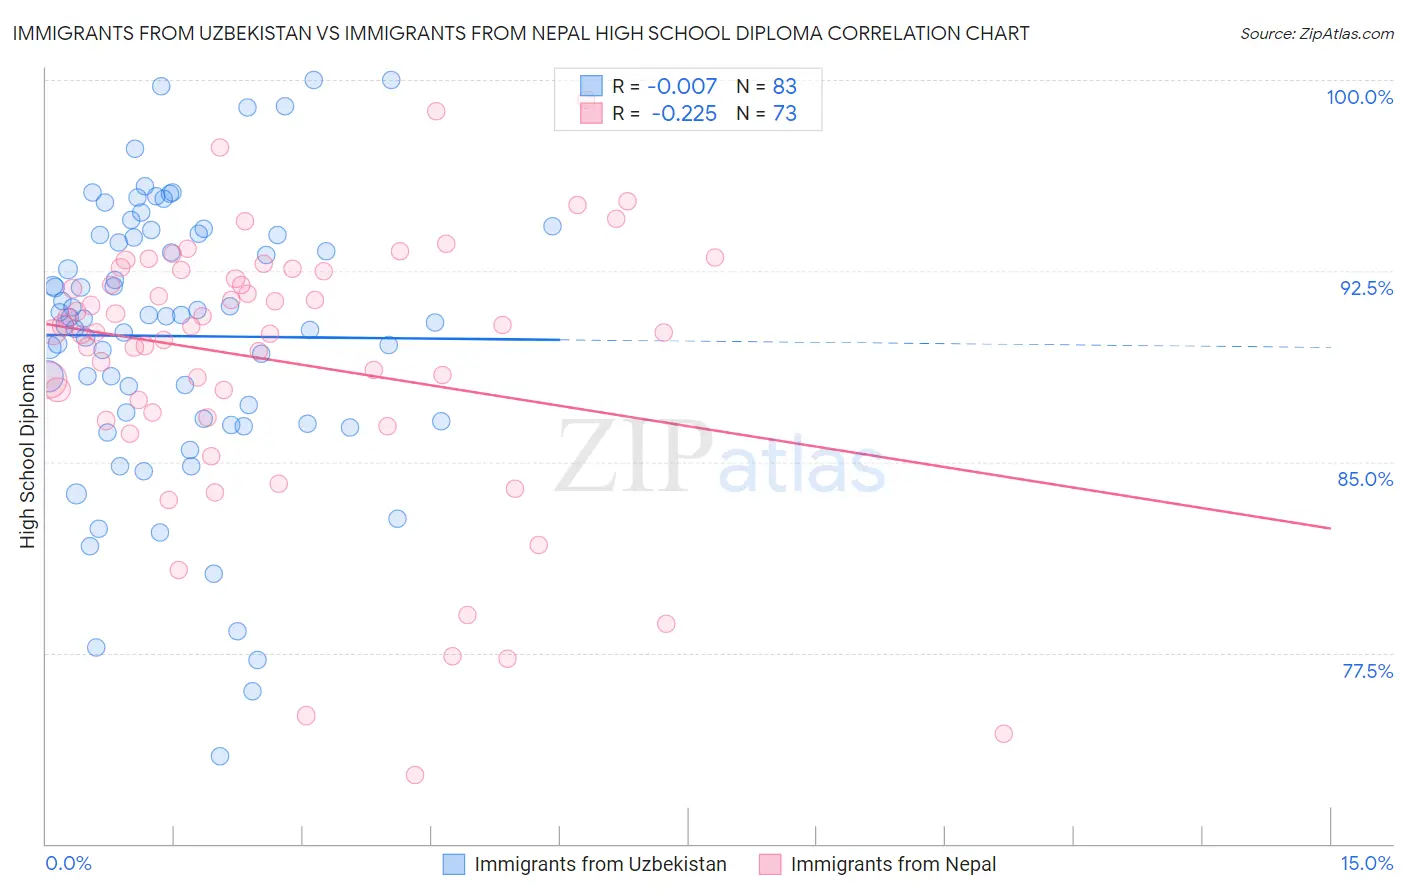
Immigrants from Uzbekistan vs Immigrants from Nepal High School Diploma Correlation Chart

The statistical analysis conducted on geographies consisting of 118,765,305 people shows no correlation between the proportion of Immigrants from Uzbekistan and percentage of population with at least high school diploma education in the United States with a correlation coefficient (R) of -0.007 and weighted average of 87.8%. Similarly, the statistical analysis conducted on geographies consisting of 186,780,807 people shows a weak negative correlation between the proportion of Immigrants from Nepal and percentage of population with at least high school diploma education in the United States with a correlation coefficient (R) of -0.225 and weighted average of 89.3%, a difference of 1.7%.
Immigrants from Uzbekistan vs Immigrants from Nepal High School Diploma

High School Diploma Correlation Summary

MeasurementImmigrants from UzbekistanImmigrants from Nepal
Minimum73.4%72.7%
Maximum100.0%99.2%
Range26.6%26.5%
Mean89.9%89.0%
Median90.7%90.1%
Interquartile 25% (IQ1)86.6%86.9%
Interquartile 75% (IQ3)93.9%92.5%
Interquartile Range (IQR)7.3%5.6%
Standard Deviation (Sample)5.5%5.4%
Standard Deviation (Population)5.5%5.4%

Similar Demographics by High School Diploma

Demographics Similar to Immigrants from Uzbekistan by High School Diploma

In terms of high school diploma, the demographic groups most similar to Immigrants from Uzbekistan are Cheyenne (87.8%, a difference of 0.0%), Immigrants from Philippines (87.8%, a difference of 0.020%), Comanche (87.9%, a difference of 0.030%), Choctaw (87.8%, a difference of 0.030%), and Peruvian (87.8%, a difference of 0.040%).
DemographicsRating | RankHigh School Diploma
Immigrants | Thailand
3.1
/100
|
#234
Tragic
88.0%
Immigrants | Bahamas
2.9
/100
|
#235
Tragic
88.0%
Sub-Saharan Africans
2.8
/100
|
#236
Tragic
87.9%
Taiwanese
2.8
/100
|
#237
Tragic
87.9%
Sioux
2.7
/100
|
#238
Tragic
87.9%
South Americans
2.7
/100
|
#239
Tragic
87.9%
Comanche
2.2
/100
|
#240
Tragic
87.9%
Immigrants | Uzbekistan
2.1
/100
|
#241
Tragic
87.8%
Cheyenne
2.1
/100
|
#242
Tragic
87.8%
Immigrants | Philippines
1.9
/100
|
#243
Tragic
87.8%
Choctaw
1.9
/100
|
#244
Tragic
87.8%
Peruvians
1.9
/100
|
#245
Tragic
87.8%
Immigrants | Eritrea
1.7
/100
|
#246
Tragic
87.8%
Immigrants | Costa Rica
1.7
/100
|
#247
Tragic
87.8%
Spanish Americans
1.5
/100
|
#248
Tragic
87.7%

Demographics Similar to Immigrants from Nepal by High School Diploma

In terms of high school diploma, the demographic groups most similar to Immigrants from Nepal are Brazilian (89.3%, a difference of 0.0%), Bermudan (89.3%, a difference of 0.0%), Cree (89.3%, a difference of 0.0%), Immigrants from China (89.3%, a difference of 0.010%), and Laotian (89.3%, a difference of 0.010%).
DemographicsRating | RankHigh School Diploma
Immigrants | Malaysia
63.5
/100
|
#157
Good
89.3%
Immigrants | Pakistan
62.5
/100
|
#158
Good
89.3%
Immigrants | China
62.0
/100
|
#159
Good
89.3%
Laotians
61.8
/100
|
#160
Good
89.3%
Brazilians
61.2
/100
|
#161
Good
89.3%
Bermudans
61.1
/100
|
#162
Good
89.3%
Cree
61.1
/100
|
#163
Good
89.3%
Immigrants | Nepal
61.1
/100
|
#164
Good
89.3%
Immigrants | Asia
59.8
/100
|
#165
Average
89.3%
Immigrants | Albania
59.4
/100
|
#166
Average
89.3%
Immigrants | Hong Kong
58.6
/100
|
#167
Average
89.3%
Delaware
55.8
/100
|
#168
Average
89.2%
Iroquois
55.1
/100
|
#169
Average
89.2%
Immigrants | Morocco
53.3
/100
|
#170
Average
89.2%
Spanish
52.9
/100
|
#171
Average
89.2%