Immigrants from Uzbekistan vs Bolivian 6th Grade
COMPARE
Immigrants from Uzbekistan
Bolivian
6th Grade
6th Grade Comparison
Immigrants from Uzbekistan
Bolivians
96.3%
6TH GRADE
0.2/ 100
METRIC RATING
268th/ 347
METRIC RANK
96.5%
6TH GRADE
1.0/ 100
METRIC RATING
247th/ 347
METRIC RANK
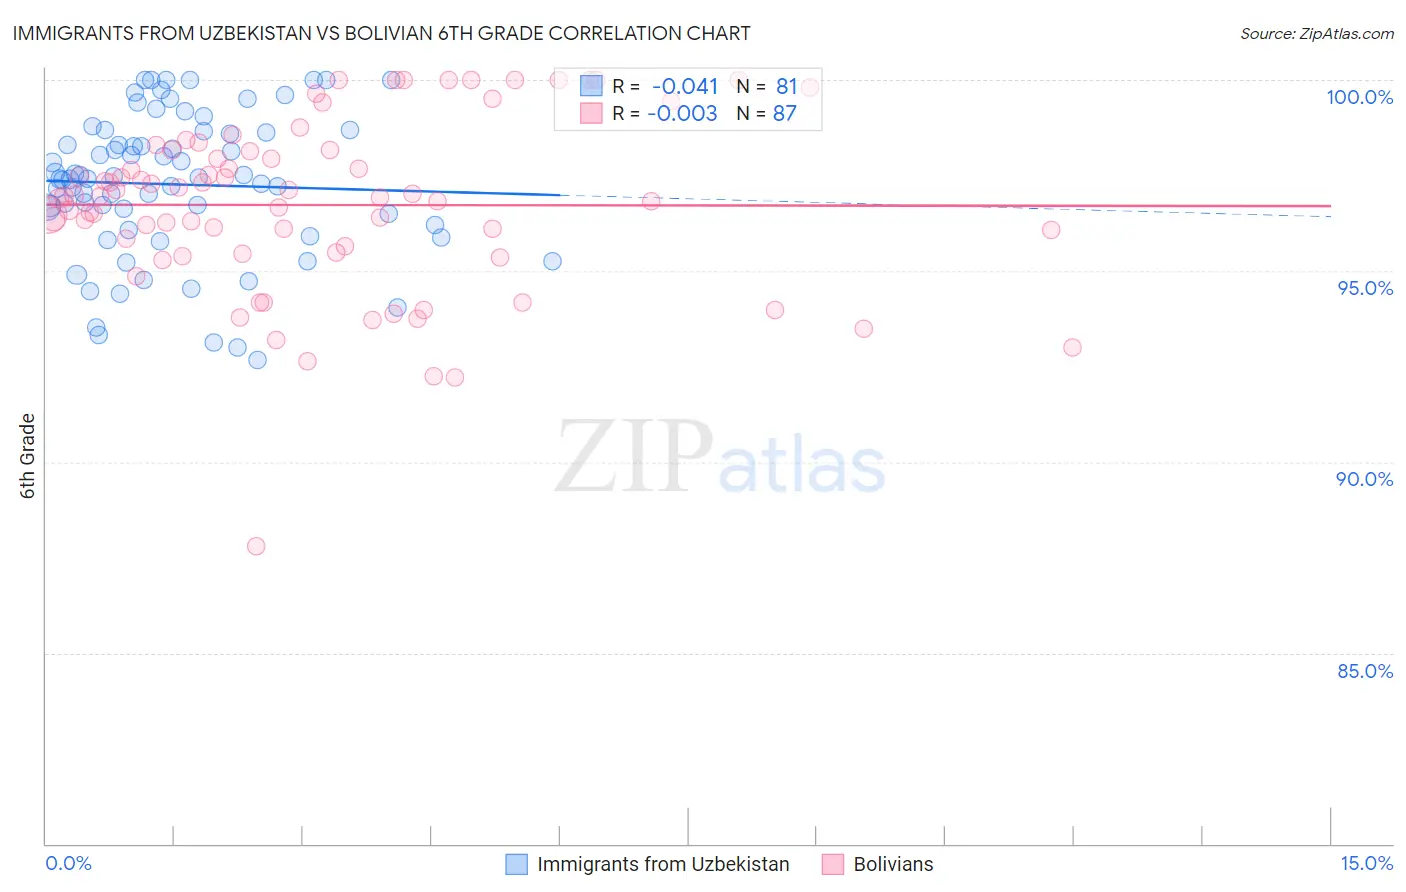
Immigrants from Uzbekistan vs Bolivian 6th Grade Correlation Chart
The statistical analysis conducted on geographies consisting of 118,593,934 people shows no correlation between the proportion of Immigrants from Uzbekistan and percentage of population with at least 6th grade education in the United States with a correlation coefficient (R) of -0.041 and weighted average of 96.3%. Similarly, the statistical analysis conducted on geographies consisting of 184,666,822 people shows no correlation between the proportion of Bolivians and percentage of population with at least 6th grade education in the United States with a correlation coefficient (R) of -0.003 and weighted average of 96.5%, a difference of 0.20%.
6th Grade Correlation Summary
| Measurement | Immigrants from Uzbekistan | Bolivian |
| Minimum | 92.7% | 87.8% |
| Maximum | 100.0% | 100.0% |
| Range | 7.3% | 12.2% |
| Mean | 97.3% | 96.7% |
| Median | 97.4% | 96.9% |
| Interquartile 25% (IQ1) | 96.1% | 95.5% |
| Interquartile 75% (IQ3) | 98.7% | 98.2% |
| Interquartile Range (IQR) | 2.5% | 2.7% |
| Standard Deviation (Sample) | 1.9% | 2.3% |
| Standard Deviation (Population) | 1.9% | 2.2% |
Similar Demographics by 6th Grade
Demographics Similar to Immigrants from Uzbekistan by 6th Grade
In terms of 6th grade, the demographic groups most similar to Immigrants from Uzbekistan are West Indian (96.3%, a difference of 0.0%), Immigrants from South America (96.3%, a difference of 0.010%), Immigrants from Hong Kong (96.3%, a difference of 0.010%), Afghan (96.4%, a difference of 0.020%), and Ghanaian (96.4%, a difference of 0.030%).
| Demographics | Rating | Rank | 6th Grade |
| Immigrants | Sierra Leone | 0.4 /100 | #261 | Tragic 96.4% |
| Immigrants | Nigeria | 0.3 /100 | #262 | Tragic 96.4% |
| Immigrants | Colombia | 0.3 /100 | #263 | Tragic 96.4% |
| Armenians | 0.3 /100 | #264 | Tragic 96.4% |
| Immigrants | Jamaica | 0.2 /100 | #265 | Tragic 96.4% |
| Ghanaians | 0.2 /100 | #266 | Tragic 96.4% |
| Afghans | 0.2 /100 | #267 | Tragic 96.4% |
| Immigrants | Uzbekistan | 0.2 /100 | #268 | Tragic 96.3% |
| West Indians | 0.2 /100 | #269 | Tragic 96.3% |
| Immigrants | South America | 0.2 /100 | #270 | Tragic 96.3% |
| Immigrants | Hong Kong | 0.2 /100 | #271 | Tragic 96.3% |
| Immigrants | Bolivia | 0.1 /100 | #272 | Tragic 96.3% |
| Immigrants | Cameroon | 0.1 /100 | #273 | Tragic 96.3% |
| Immigrants | Philippines | 0.1 /100 | #274 | Tragic 96.3% |
| Immigrants | Ghana | 0.1 /100 | #275 | Tragic 96.3% |
Demographics Similar to Bolivians by 6th Grade
In terms of 6th grade, the demographic groups most similar to Bolivians are Tohono O'odham (96.5%, a difference of 0.0%), Colombian (96.5%, a difference of 0.010%), Immigrants from Costa Rica (96.6%, a difference of 0.030%), Immigrants from Africa (96.6%, a difference of 0.030%), and Immigrants from Middle Africa (96.5%, a difference of 0.030%).
| Demographics | Rating | Rank | 6th Grade |
| Koreans | 1.9 /100 | #240 | Tragic 96.6% |
| Senegalese | 1.8 /100 | #241 | Tragic 96.6% |
| Immigrants | Asia | 1.8 /100 | #242 | Tragic 96.6% |
| Immigrants | Liberia | 1.6 /100 | #243 | Tragic 96.6% |
| Ethiopians | 1.5 /100 | #244 | Tragic 96.6% |
| Immigrants | Costa Rica | 1.3 /100 | #245 | Tragic 96.6% |
| Immigrants | Africa | 1.3 /100 | #246 | Tragic 96.6% |
| Bolivians | 1.0 /100 | #247 | Tragic 96.5% |
| Tohono O'odham | 1.0 /100 | #248 | Tragic 96.5% |
| Colombians | 0.9 /100 | #249 | Tragic 96.5% |
| Immigrants | Middle Africa | 0.8 /100 | #250 | Tragic 96.5% |
| Immigrants | Senegal | 0.7 /100 | #251 | Tragic 96.5% |
| Immigrants | Uruguay | 0.6 /100 | #252 | Tragic 96.5% |
| Jamaicans | 0.6 /100 | #253 | Tragic 96.5% |
| Immigrants | Ethiopia | 0.6 /100 | #254 | Tragic 96.5% |