Immigrants from Uruguay vs Lithuanian 4th Grade
COMPARE
Immigrants from Uruguay
Lithuanian
4th Grade
4th Grade Comparison
Immigrants from Uruguay
Lithuanians
97.1%
4TH GRADE
1.2/ 100
METRIC RATING
246th/ 347
METRIC RANK
98.3%
4TH GRADE
100.0/ 100
METRIC RATING
21st/ 347
METRIC RANK
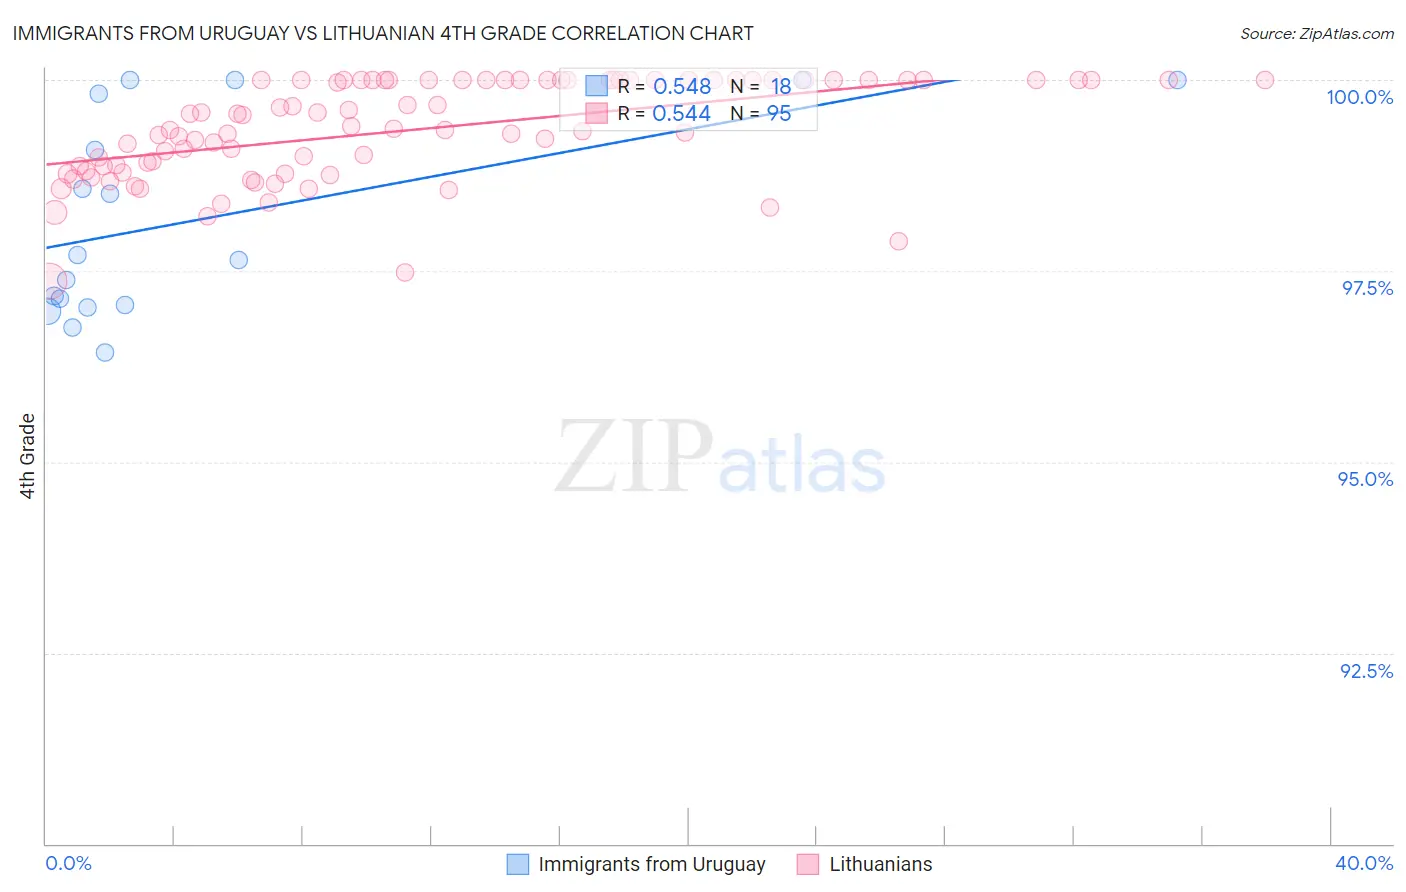
Immigrants from Uruguay vs Lithuanian 4th Grade Correlation Chart
The statistical analysis conducted on geographies consisting of 133,259,667 people shows a substantial positive correlation between the proportion of Immigrants from Uruguay and percentage of population with at least 4th grade education in the United States with a correlation coefficient (R) of 0.548 and weighted average of 97.1%. Similarly, the statistical analysis conducted on geographies consisting of 421,946,231 people shows a substantial positive correlation between the proportion of Lithuanians and percentage of population with at least 4th grade education in the United States with a correlation coefficient (R) of 0.544 and weighted average of 98.3%, a difference of 1.3%.
4th Grade Correlation Summary
| Measurement | Immigrants from Uruguay | Lithuanian |
| Minimum | 96.4% | 97.4% |
| Maximum | 100.0% | 100.0% |
| Range | 3.6% | 2.6% |
| Mean | 98.2% | 99.3% |
| Median | 97.7% | 99.4% |
| Interquartile 25% (IQ1) | 97.1% | 98.8% |
| Interquartile 75% (IQ3) | 99.8% | 100.0% |
| Interquartile Range (IQR) | 2.8% | 1.2% |
| Standard Deviation (Sample) | 1.3% | 0.65% |
| Standard Deviation (Population) | 1.3% | 0.65% |
Similar Demographics by 4th Grade
Demographics Similar to Immigrants from Uruguay by 4th Grade
In terms of 4th grade, the demographic groups most similar to Immigrants from Uruguay are Korean (97.1%, a difference of 0.0%), Immigrants from Eastern Africa (97.1%, a difference of 0.0%), Ethiopian (97.1%, a difference of 0.0%), Immigrants from Asia (97.1%, a difference of 0.0%), and Asian (97.1%, a difference of 0.010%).
| Demographics | Rating | Rank | 4th Grade |
| Nigerians | 1.8 /100 | #239 | Tragic 97.1% |
| Colombians | 1.6 /100 | #240 | Tragic 97.1% |
| Immigrants | Indonesia | 1.5 /100 | #241 | Tragic 97.1% |
| Asians | 1.4 /100 | #242 | Tragic 97.1% |
| U.S. Virgin Islanders | 1.4 /100 | #243 | Tragic 97.1% |
| Koreans | 1.3 /100 | #244 | Tragic 97.1% |
| Immigrants | Eastern Africa | 1.2 /100 | #245 | Tragic 97.1% |
| Immigrants | Uruguay | 1.2 /100 | #246 | Tragic 97.1% |
| Ethiopians | 1.2 /100 | #247 | Tragic 97.1% |
| Immigrants | Asia | 1.2 /100 | #248 | Tragic 97.1% |
| Immigrants | Africa | 1.0 /100 | #249 | Tragic 97.1% |
| Immigrants | Senegal | 0.9 /100 | #250 | Tragic 97.1% |
| South Americans | 0.8 /100 | #251 | Tragic 97.1% |
| Jamaicans | 0.8 /100 | #252 | Tragic 97.1% |
| Immigrants | Liberia | 0.8 /100 | #253 | Tragic 97.1% |
Demographics Similar to Lithuanians by 4th Grade
In terms of 4th grade, the demographic groups most similar to Lithuanians are Finnish (98.3%, a difference of 0.0%), Irish (98.4%, a difference of 0.010%), Alaska Native (98.4%, a difference of 0.010%), Polish (98.4%, a difference of 0.020%), and Sioux (98.3%, a difference of 0.020%).
| Demographics | Rating | Rank | 4th Grade |
| Carpatho Rusyns | 100.0 /100 | #14 | Exceptional 98.4% |
| Dutch | 100.0 /100 | #15 | Exceptional 98.4% |
| Scottish | 100.0 /100 | #16 | Exceptional 98.4% |
| Pennsylvania Germans | 100.0 /100 | #17 | Exceptional 98.4% |
| Poles | 100.0 /100 | #18 | Exceptional 98.4% |
| Irish | 100.0 /100 | #19 | Exceptional 98.4% |
| Alaska Natives | 100.0 /100 | #20 | Exceptional 98.4% |
| Lithuanians | 100.0 /100 | #21 | Exceptional 98.3% |
| Finns | 100.0 /100 | #22 | Exceptional 98.3% |
| Sioux | 100.0 /100 | #23 | Exceptional 98.3% |
| Danes | 100.0 /100 | #24 | Exceptional 98.3% |
| Scotch-Irish | 100.0 /100 | #25 | Exceptional 98.3% |
| Croatians | 100.0 /100 | #26 | Exceptional 98.3% |
| French Canadians | 100.0 /100 | #27 | Exceptional 98.3% |
| French | 100.0 /100 | #28 | Exceptional 98.3% |