Immigrants from Uruguay vs Jordanian Doctorate Degree
COMPARE
Immigrants from Uruguay
Jordanian
Doctorate Degree
Doctorate Degree Comparison
Immigrants from Uruguay
Jordanians
1.7%
DOCTORATE DEGREE
9.2/ 100
METRIC RATING
220th/ 347
METRIC RANK
2.0%
DOCTORATE DEGREE
92.1/ 100
METRIC RATING
126th/ 347
METRIC RANK
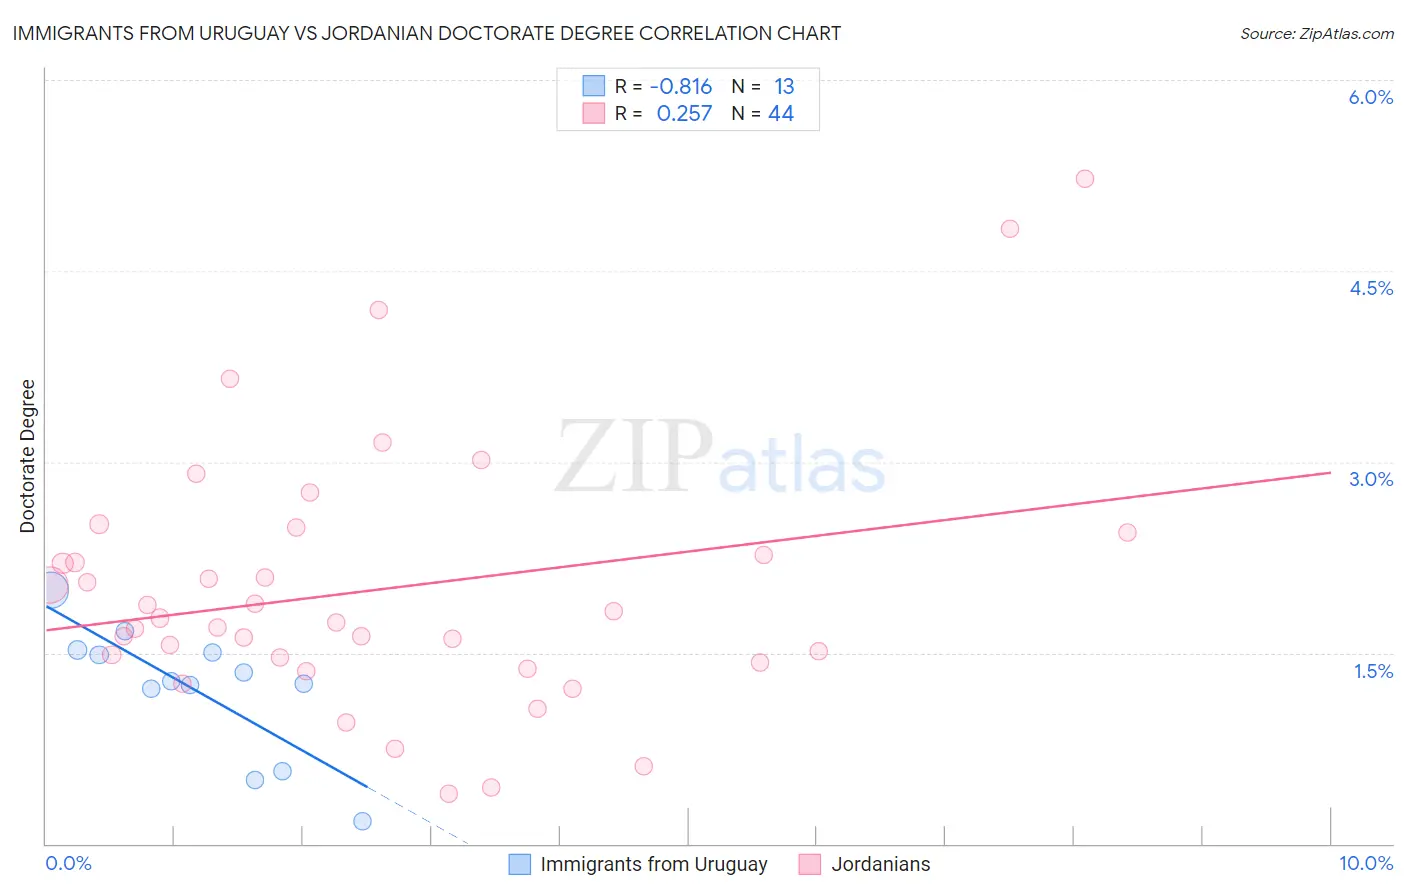
Immigrants from Uruguay vs Jordanian Doctorate Degree Correlation Chart
The statistical analysis conducted on geographies consisting of 133,064,072 people shows a very strong negative correlation between the proportion of Immigrants from Uruguay and percentage of population with at least doctorate degree education in the United States with a correlation coefficient (R) of -0.816 and weighted average of 1.7%. Similarly, the statistical analysis conducted on geographies consisting of 166,045,930 people shows a weak positive correlation between the proportion of Jordanians and percentage of population with at least doctorate degree education in the United States with a correlation coefficient (R) of 0.257 and weighted average of 2.0%, a difference of 19.0%.
Doctorate Degree Correlation Summary
| Measurement | Immigrants from Uruguay | Jordanian |
| Minimum | 0.18% | 0.39% |
| Maximum | 2.0% | 5.2% |
| Range | 1.8% | 4.8% |
| Mean | 1.2% | 2.0% |
| Median | 1.3% | 1.8% |
| Interquartile 25% (IQ1) | 0.89% | 1.4% |
| Interquartile 75% (IQ3) | 1.5% | 2.4% |
| Interquartile Range (IQR) | 0.62% | 0.91% |
| Standard Deviation (Sample) | 0.51% | 1.0% |
| Standard Deviation (Population) | 0.49% | 1.0% |
Similar Demographics by Doctorate Degree
Demographics Similar to Immigrants from Uruguay by Doctorate Degree
In terms of doctorate degree, the demographic groups most similar to Immigrants from Uruguay are Nonimmigrants (1.7%, a difference of 0.19%), Immigrants from Venezuela (1.7%, a difference of 0.26%), Immigrants from Iraq (1.7%, a difference of 0.66%), Immigrants from Bosnia and Herzegovina (1.7%, a difference of 0.72%), and Immigrants from Poland (1.7%, a difference of 0.94%).
| Demographics | Rating | Rank | Doctorate Degree |
| Koreans | 14.2 /100 | #213 | Poor 1.7% |
| Pueblo | 14.2 /100 | #214 | Poor 1.7% |
| Alaskan Athabascans | 13.8 /100 | #215 | Poor 1.7% |
| Immigrants | Burma/Myanmar | 13.5 /100 | #216 | Poor 1.7% |
| Spanish Americans | 12.9 /100 | #217 | Poor 1.7% |
| Tlingit-Haida | 11.9 /100 | #218 | Poor 1.7% |
| Immigrants | Iraq | 10.7 /100 | #219 | Poor 1.7% |
| Immigrants | Uruguay | 9.2 /100 | #220 | Tragic 1.7% |
| Immigrants | Nonimmigrants | 8.8 /100 | #221 | Tragic 1.7% |
| Immigrants | Venezuela | 8.7 /100 | #222 | Tragic 1.7% |
| Immigrants | Bosnia and Herzegovina | 7.8 /100 | #223 | Tragic 1.7% |
| Immigrants | Poland | 7.4 /100 | #224 | Tragic 1.7% |
| Immigrants | Colombia | 6.7 /100 | #225 | Tragic 1.7% |
| Osage | 6.5 /100 | #226 | Tragic 1.7% |
| Panamanians | 6.3 /100 | #227 | Tragic 1.7% |
Demographics Similar to Jordanians by Doctorate Degree
In terms of doctorate degree, the demographic groups most similar to Jordanians are Palestinian (2.0%, a difference of 0.040%), Moroccan (2.0%, a difference of 0.42%), Immigrants from Zaire (2.0%, a difference of 0.46%), Ute (2.0%, a difference of 0.52%), and Canadian (2.0%, a difference of 0.67%).
| Demographics | Rating | Rank | Doctorate Degree |
| Pakistanis | 95.8 /100 | #119 | Exceptional 2.0% |
| Immigrants | Morocco | 95.5 /100 | #120 | Exceptional 2.0% |
| Immigrants | Jordan | 94.8 /100 | #121 | Exceptional 2.0% |
| Immigrants | Southern Europe | 94.7 /100 | #122 | Exceptional 2.0% |
| Croatians | 94.0 /100 | #123 | Exceptional 2.0% |
| Ute | 93.2 /100 | #124 | Exceptional 2.0% |
| Moroccans | 93.0 /100 | #125 | Exceptional 2.0% |
| Jordanians | 92.1 /100 | #126 | Exceptional 2.0% |
| Palestinians | 92.0 /100 | #127 | Exceptional 2.0% |
| Immigrants | Zaire | 91.1 /100 | #128 | Exceptional 2.0% |
| Canadians | 90.6 /100 | #129 | Exceptional 2.0% |
| Immigrants | Ukraine | 90.5 /100 | #130 | Exceptional 2.0% |
| Immigrants | Sierra Leone | 90.2 /100 | #131 | Exceptional 2.0% |
| Scottish | 89.4 /100 | #132 | Excellent 2.0% |
| Immigrants | Uzbekistan | 89.3 /100 | #133 | Excellent 2.0% |