Immigrants from Uruguay vs Cherokee 8th Grade
COMPARE
Immigrants from Uruguay
Cherokee
8th Grade
8th Grade Comparison
Immigrants from Uruguay
Cherokee
94.8%
8TH GRADE
0.3/ 100
METRIC RATING
268th/ 347
METRIC RANK
96.5%
8TH GRADE
99.0/ 100
METRIC RATING
86th/ 347
METRIC RANK
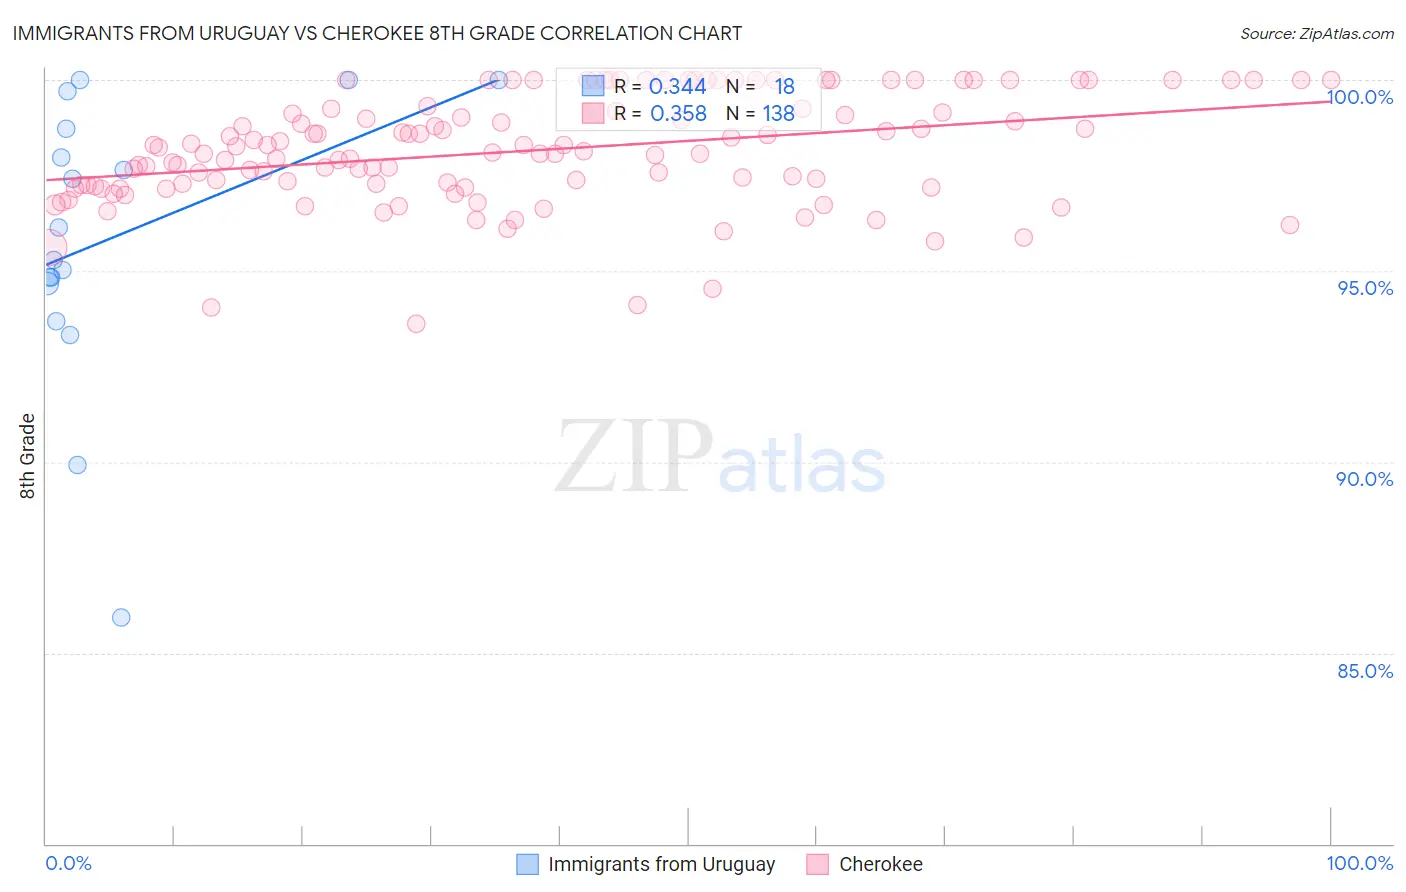
Immigrants from Uruguay vs Cherokee 8th Grade Correlation Chart
The statistical analysis conducted on geographies consisting of 133,259,667 people shows a mild positive correlation between the proportion of Immigrants from Uruguay and percentage of population with at least 8th grade education in the United States with a correlation coefficient (R) of 0.344 and weighted average of 94.8%. Similarly, the statistical analysis conducted on geographies consisting of 493,719,571 people shows a mild positive correlation between the proportion of Cherokee and percentage of population with at least 8th grade education in the United States with a correlation coefficient (R) of 0.358 and weighted average of 96.5%, a difference of 1.7%.
8th Grade Correlation Summary
| Measurement | Immigrants from Uruguay | Cherokee |
| Minimum | 85.9% | 93.6% |
| Maximum | 100.0% | 100.0% |
| Range | 14.1% | 6.4% |
| Mean | 95.8% | 98.2% |
| Median | 95.7% | 98.1% |
| Interquartile 25% (IQ1) | 94.7% | 97.2% |
| Interquartile 75% (IQ3) | 98.7% | 99.2% |
| Interquartile Range (IQR) | 4.1% | 2.0% |
| Standard Deviation (Sample) | 3.7% | 1.4% |
| Standard Deviation (Population) | 3.6% | 1.4% |
Similar Demographics by 8th Grade
Demographics Similar to Immigrants from Uruguay by 8th Grade
In terms of 8th grade, the demographic groups most similar to Immigrants from Uruguay are Immigrants from Ghana (94.8%, a difference of 0.0%), West Indian (94.8%, a difference of 0.020%), Immigrants from Thailand (94.8%, a difference of 0.020%), Immigrants from Uzbekistan (94.8%, a difference of 0.040%), and Immigrants from Afghanistan (94.8%, a difference of 0.050%).
| Demographics | Rating | Rank | 8th Grade |
| Immigrants | Costa Rica | 0.5 /100 | #261 | Tragic 94.9% |
| Immigrants | Nigeria | 0.4 /100 | #262 | Tragic 94.9% |
| Immigrants | Hong Kong | 0.4 /100 | #263 | Tragic 94.9% |
| South Americans | 0.4 /100 | #264 | Tragic 94.9% |
| Yuman | 0.4 /100 | #265 | Tragic 94.9% |
| West Indians | 0.3 /100 | #266 | Tragic 94.8% |
| Immigrants | Ghana | 0.3 /100 | #267 | Tragic 94.8% |
| Immigrants | Uruguay | 0.3 /100 | #268 | Tragic 94.8% |
| Immigrants | Thailand | 0.2 /100 | #269 | Tragic 94.8% |
| Immigrants | Uzbekistan | 0.2 /100 | #270 | Tragic 94.8% |
| Immigrants | Afghanistan | 0.2 /100 | #271 | Tragic 94.8% |
| Immigrants | South America | 0.2 /100 | #272 | Tragic 94.8% |
| Immigrants | Western Africa | 0.2 /100 | #273 | Tragic 94.8% |
| Trinidadians and Tobagonians | 0.2 /100 | #274 | Tragic 94.7% |
| Immigrants | Colombia | 0.2 /100 | #275 | Tragic 94.7% |
Demographics Similar to Cherokee by 8th Grade
In terms of 8th grade, the demographic groups most similar to Cherokee are Immigrants from South Africa (96.5%, a difference of 0.0%), Immigrants from Australia (96.5%, a difference of 0.0%), Immigrants from Belgium (96.5%, a difference of 0.010%), Immigrants from Western Europe (96.4%, a difference of 0.010%), and Icelander (96.5%, a difference of 0.020%).
| Demographics | Rating | Rank | 8th Grade |
| Puget Sound Salish | 99.3 /100 | #79 | Exceptional 96.5% |
| Delaware | 99.2 /100 | #80 | Exceptional 96.5% |
| Romanians | 99.2 /100 | #81 | Exceptional 96.5% |
| Turks | 99.2 /100 | #82 | Exceptional 96.5% |
| Icelanders | 99.2 /100 | #83 | Exceptional 96.5% |
| Immigrants | Belgium | 99.1 /100 | #84 | Exceptional 96.5% |
| Immigrants | South Africa | 99.1 /100 | #85 | Exceptional 96.5% |
| Cherokee | 99.0 /100 | #86 | Exceptional 96.5% |
| Immigrants | Australia | 99.0 /100 | #87 | Exceptional 96.5% |
| Immigrants | Western Europe | 99.0 /100 | #88 | Exceptional 96.4% |
| Chickasaw | 98.9 /100 | #89 | Exceptional 96.4% |
| Immigrants | Sweden | 98.9 /100 | #90 | Exceptional 96.4% |
| Thais | 98.9 /100 | #91 | Exceptional 96.4% |
| Menominee | 98.9 /100 | #92 | Exceptional 96.4% |
| Immigrants | Denmark | 98.8 /100 | #93 | Exceptional 96.4% |