Immigrants from Ukraine vs Immigrants from Venezuela 11th Grade
COMPARE
Immigrants from Ukraine
Immigrants from Venezuela
11th Grade
11th Grade Comparison
Immigrants from Ukraine
Immigrants from Venezuela
93.0%
11TH GRADE
89.8/ 100
METRIC RATING
129th/ 347
METRIC RANK
92.7%
11TH GRADE
72.0/ 100
METRIC RATING
158th/ 347
METRIC RANK
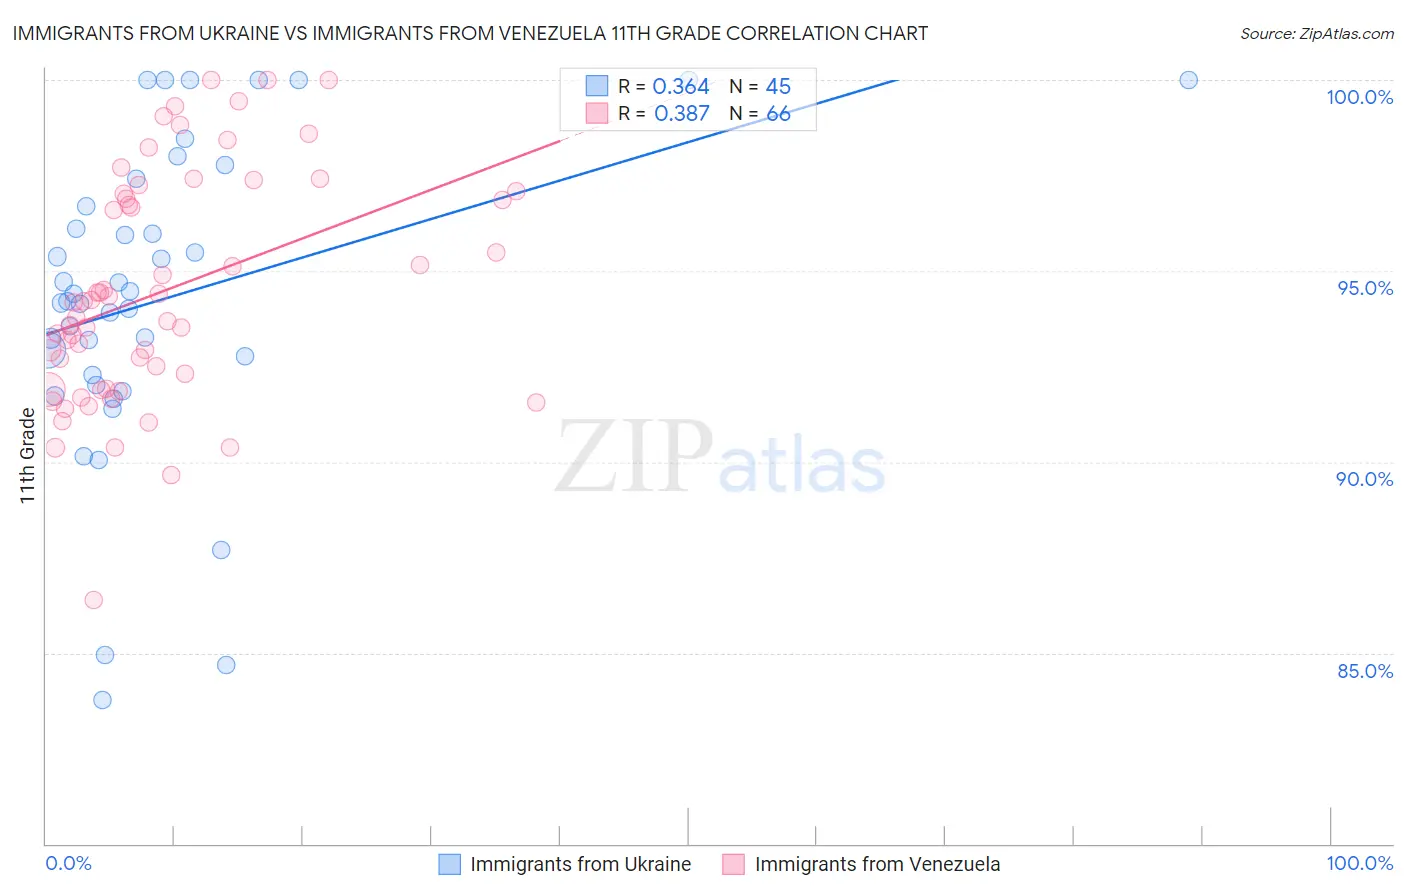
Immigrants from Ukraine vs Immigrants from Venezuela 11th Grade Correlation Chart
The statistical analysis conducted on geographies consisting of 289,714,613 people shows a mild positive correlation between the proportion of Immigrants from Ukraine and percentage of population with at least 11th grade education in the United States with a correlation coefficient (R) of 0.364 and weighted average of 93.0%. Similarly, the statistical analysis conducted on geographies consisting of 287,866,258 people shows a mild positive correlation between the proportion of Immigrants from Venezuela and percentage of population with at least 11th grade education in the United States with a correlation coefficient (R) of 0.387 and weighted average of 92.7%, a difference of 0.30%.
11th Grade Correlation Summary
| Measurement | Immigrants from Ukraine | Immigrants from Venezuela |
| Minimum | 83.8% | 86.4% |
| Maximum | 100.0% | 100.0% |
| Range | 16.2% | 13.6% |
| Mean | 94.3% | 94.5% |
| Median | 94.2% | 94.2% |
| Interquartile 25% (IQ1) | 92.1% | 91.9% |
| Interquartile 75% (IQ3) | 97.1% | 97.0% |
| Interquartile Range (IQR) | 4.9% | 5.1% |
| Standard Deviation (Sample) | 4.0% | 3.0% |
| Standard Deviation (Population) | 4.0% | 3.0% |
Similar Demographics by 11th Grade
Demographics Similar to Immigrants from Ukraine by 11th Grade
In terms of 11th grade, the demographic groups most similar to Immigrants from Ukraine are Albanian (93.0%, a difference of 0.010%), Egyptian (93.0%, a difference of 0.010%), Immigrants from Bosnia and Herzegovina (93.0%, a difference of 0.020%), Mongolian (93.0%, a difference of 0.050%), and Delaware (93.0%, a difference of 0.060%).
| Demographics | Rating | Rank | 11th Grade |
| Immigrants | Belarus | 96.3 /100 | #122 | Exceptional 93.3% |
| Immigrants | Greece | 95.9 /100 | #123 | Exceptional 93.2% |
| Immigrants | Eastern Europe | 95.9 /100 | #124 | Exceptional 93.2% |
| Immigrants | Sri Lanka | 95.6 /100 | #125 | Exceptional 93.2% |
| Basques | 95.2 /100 | #126 | Exceptional 93.2% |
| Immigrants | Kazakhstan | 92.4 /100 | #127 | Exceptional 93.1% |
| Immigrants | Jordan | 92.4 /100 | #128 | Exceptional 93.1% |
| Immigrants | Ukraine | 89.8 /100 | #129 | Excellent 93.0% |
| Albanians | 89.5 /100 | #130 | Excellent 93.0% |
| Egyptians | 89.5 /100 | #131 | Excellent 93.0% |
| Immigrants | Bosnia and Herzegovina | 89.0 /100 | #132 | Excellent 93.0% |
| Mongolians | 87.6 /100 | #133 | Excellent 93.0% |
| Delaware | 87.3 /100 | #134 | Excellent 93.0% |
| Immigrants | Italy | 86.6 /100 | #135 | Excellent 92.9% |
| Cree | 85.9 /100 | #136 | Excellent 92.9% |
Demographics Similar to Immigrants from Venezuela by 11th Grade
In terms of 11th grade, the demographic groups most similar to Immigrants from Venezuela are American (92.7%, a difference of 0.0%), Immigrants from Spain (92.7%, a difference of 0.010%), Immigrants from Eastern Asia (92.7%, a difference of 0.010%), Brazilian (92.8%, a difference of 0.020%), and Osage (92.7%, a difference of 0.020%).
| Demographics | Rating | Rank | 11th Grade |
| Potawatomi | 74.3 /100 | #151 | Good 92.8% |
| Iraqis | 74.2 /100 | #152 | Good 92.8% |
| Brazilians | 73.9 /100 | #153 | Good 92.8% |
| Osage | 73.4 /100 | #154 | Good 92.7% |
| Argentineans | 73.4 /100 | #155 | Good 92.7% |
| Immigrants | Spain | 73.0 /100 | #156 | Good 92.7% |
| Immigrants | Eastern Asia | 72.6 /100 | #157 | Good 92.7% |
| Immigrants | Venezuela | 72.0 /100 | #158 | Good 92.7% |
| Americans | 71.7 /100 | #159 | Good 92.7% |
| Immigrants | Lebanon | 70.7 /100 | #160 | Good 92.7% |
| Immigrants | Argentina | 69.8 /100 | #161 | Good 92.7% |
| Paraguayans | 68.7 /100 | #162 | Good 92.7% |
| Immigrants | Nonimmigrants | 66.6 /100 | #163 | Good 92.7% |
| Spanish | 66.2 /100 | #164 | Good 92.7% |
| Immigrants | Iraq | 63.7 /100 | #165 | Good 92.6% |