Immigrants from Ukraine vs Immigrants from Sri Lanka 12th Grade, No Diploma
COMPARE
Immigrants from Ukraine
Immigrants from Sri Lanka
12th Grade, No Diploma
12th Grade, No Diploma Comparison
Immigrants from Ukraine
Immigrants from Sri Lanka
91.8%
12TH GRADE, NO DIPLOMA
91.6/ 100
METRIC RATING
124th/ 347
METRIC RANK
92.1%
12TH GRADE, NO DIPLOMA
96.4/ 100
METRIC RATING
115th/ 347
METRIC RANK
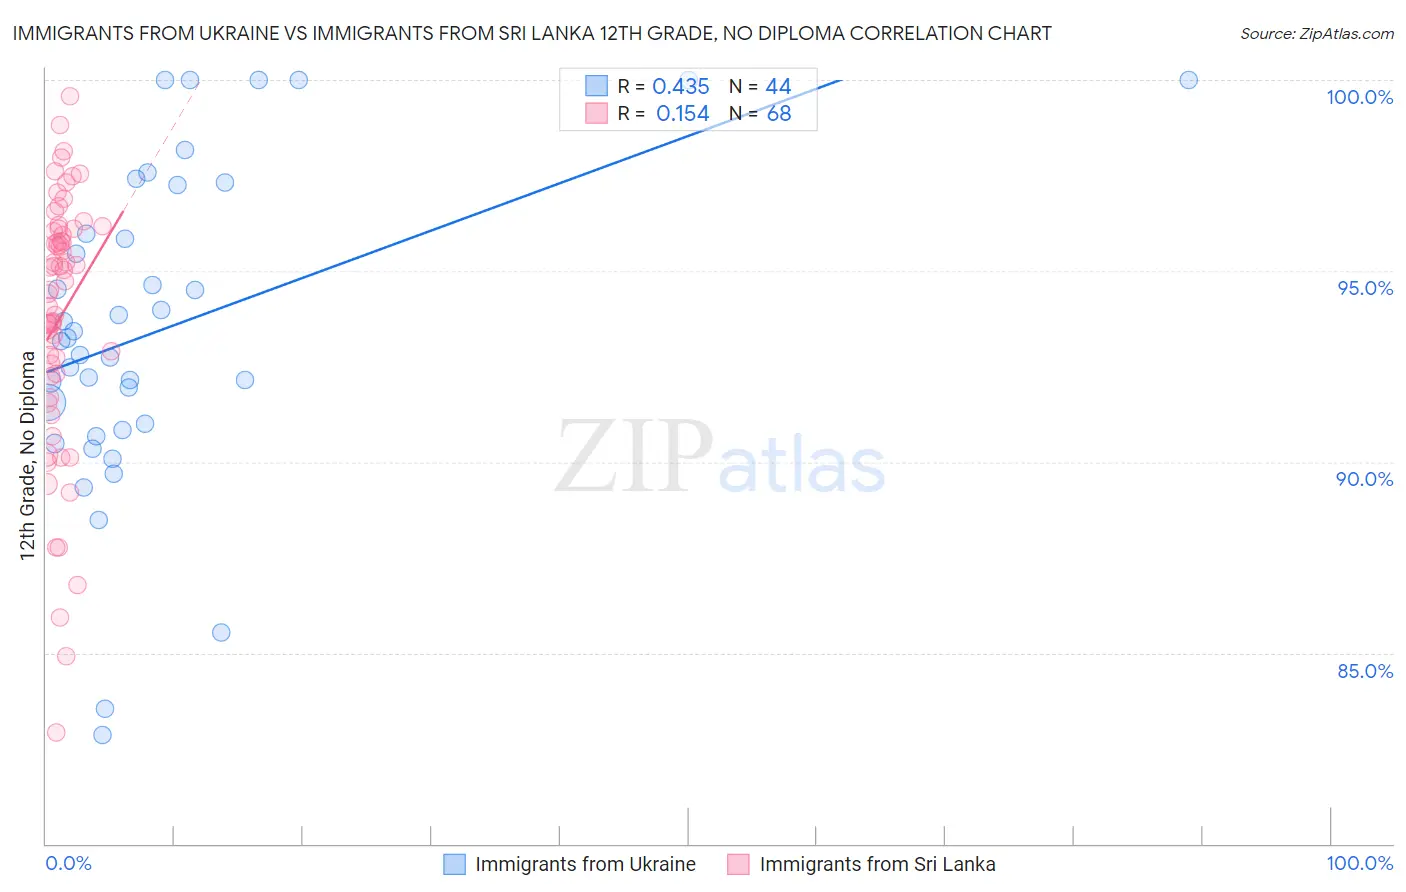
Immigrants from Ukraine vs Immigrants from Sri Lanka 12th Grade, No Diploma Correlation Chart
The statistical analysis conducted on geographies consisting of 289,712,791 people shows a moderate positive correlation between the proportion of Immigrants from Ukraine and percentage of population with at least 12th grade (no diploma) education in the United States with a correlation coefficient (R) of 0.435 and weighted average of 91.8%. Similarly, the statistical analysis conducted on geographies consisting of 149,699,055 people shows a poor positive correlation between the proportion of Immigrants from Sri Lanka and percentage of population with at least 12th grade (no diploma) education in the United States with a correlation coefficient (R) of 0.154 and weighted average of 92.1%, a difference of 0.28%.
12th Grade, No Diploma Correlation Summary
| Measurement | Immigrants from Ukraine | Immigrants from Sri Lanka |
| Minimum | 82.9% | 82.9% |
| Maximum | 100.0% | 99.6% |
| Range | 17.1% | 16.6% |
| Mean | 93.5% | 93.8% |
| Median | 93.2% | 94.6% |
| Interquartile 25% (IQ1) | 90.9% | 92.3% |
| Interquartile 75% (IQ3) | 96.6% | 96.1% |
| Interquartile Range (IQR) | 5.7% | 3.8% |
| Standard Deviation (Sample) | 4.2% | 3.4% |
| Standard Deviation (Population) | 4.1% | 3.4% |
Demographics Similar to Immigrants from Ukraine and Immigrants from Sri Lanka by 12th Grade, No Diploma
In terms of 12th grade, no diploma, the demographic groups most similar to Immigrants from Ukraine are White/Caucasian (91.8%, a difference of 0.0%), Basque (91.8%, a difference of 0.010%), Immigrants from Jordan (91.8%, a difference of 0.020%), Egyptian (91.9%, a difference of 0.040%), and Mongolian (91.8%, a difference of 0.060%). Similarly, the demographic groups most similar to Immigrants from Sri Lanka are Immigrants from Zimbabwe (92.1%, a difference of 0.010%), Yugoslavian (92.1%, a difference of 0.010%), Aleut (92.1%, a difference of 0.010%), Immigrants from Eastern Europe (92.1%, a difference of 0.010%), and Israeli (92.1%, a difference of 0.040%).
| Demographics | Rating | Rank | 12th Grade, No Diploma |
| Immigrants | Hungary | 97.0 /100 | #109 | Exceptional 92.1% |
| Palestinians | 97.0 /100 | #110 | Exceptional 92.1% |
| Immigrants | Greece | 96.9 /100 | #111 | Exceptional 92.1% |
| Israelis | 96.8 /100 | #112 | Exceptional 92.1% |
| Immigrants | Zimbabwe | 96.5 /100 | #113 | Exceptional 92.1% |
| Yugoslavians | 96.5 /100 | #114 | Exceptional 92.1% |
| Immigrants | Sri Lanka | 96.4 /100 | #115 | Exceptional 92.1% |
| Aleuts | 96.3 /100 | #116 | Exceptional 92.1% |
| Immigrants | Eastern Europe | 96.3 /100 | #117 | Exceptional 92.1% |
| Puget Sound Salish | 95.8 /100 | #118 | Exceptional 92.0% |
| Immigrants | Germany | 95.5 /100 | #119 | Exceptional 92.0% |
| Immigrants | Kazakhstan | 94.2 /100 | #120 | Exceptional 91.9% |
| Menominee | 93.5 /100 | #121 | Exceptional 91.9% |
| Ottawa | 93.1 /100 | #122 | Exceptional 91.9% |
| Egyptians | 92.5 /100 | #123 | Exceptional 91.9% |
| Immigrants | Ukraine | 91.6 /100 | #124 | Exceptional 91.8% |
| Whites/Caucasians | 91.6 /100 | #125 | Exceptional 91.8% |
| Basques | 91.3 /100 | #126 | Exceptional 91.8% |
| Immigrants | Jordan | 91.0 /100 | #127 | Exceptional 91.8% |
| Mongolians | 89.9 /100 | #128 | Excellent 91.8% |
| German Russians | 89.8 /100 | #129 | Excellent 91.8% |