Immigrants from Ukraine vs Immigrants from Central America 7th Grade
COMPARE
Immigrants from Ukraine
Immigrants from Central America
7th Grade
7th Grade Comparison
Immigrants from Ukraine
Immigrants from Central America
96.1%
7TH GRADE
55.0/ 100
METRIC RATING
170th/ 347
METRIC RANK
91.0%
7TH GRADE
0.0/ 100
METRIC RATING
344th/ 347
METRIC RANK
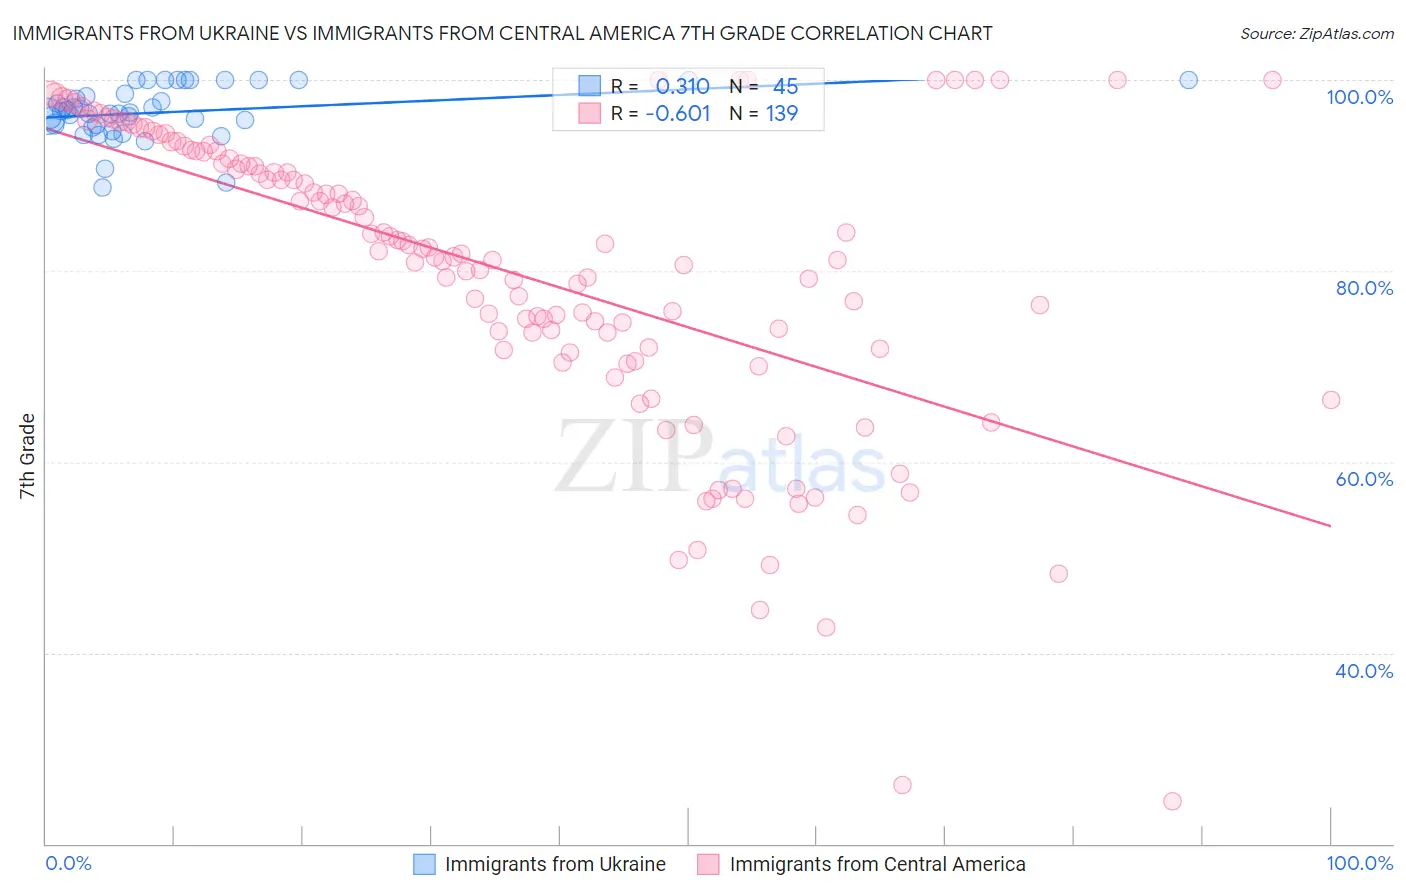
Immigrants from Ukraine vs Immigrants from Central America 7th Grade Correlation Chart
The statistical analysis conducted on geographies consisting of 289,714,613 people shows a mild positive correlation between the proportion of Immigrants from Ukraine and percentage of population with at least 7th grade education in the United States with a correlation coefficient (R) of 0.310 and weighted average of 96.1%. Similarly, the statistical analysis conducted on geographies consisting of 536,554,091 people shows a significant negative correlation between the proportion of Immigrants from Central America and percentage of population with at least 7th grade education in the United States with a correlation coefficient (R) of -0.601 and weighted average of 91.0%, a difference of 5.6%.
7th Grade Correlation Summary
| Measurement | Immigrants from Ukraine | Immigrants from Central America |
| Minimum | 88.8% | 24.5% |
| Maximum | 100.0% | 100.0% |
| Range | 11.2% | 75.5% |
| Mean | 96.6% | 79.9% |
| Median | 96.6% | 82.1% |
| Interquartile 25% (IQ1) | 95.1% | 71.8% |
| Interquartile 75% (IQ3) | 99.3% | 92.6% |
| Interquartile Range (IQR) | 4.1% | 20.7% |
| Standard Deviation (Sample) | 2.8% | 15.6% |
| Standard Deviation (Population) | 2.7% | 15.6% |
Similar Demographics by 7th Grade
Demographics Similar to Immigrants from Ukraine by 7th Grade
In terms of 7th grade, the demographic groups most similar to Immigrants from Ukraine are Ute (96.1%, a difference of 0.0%), Egyptian (96.1%, a difference of 0.0%), Immigrants from Poland (96.1%, a difference of 0.020%), Venezuelan (96.0%, a difference of 0.020%), and Immigrants from Sri Lanka (96.1%, a difference of 0.030%).
| Demographics | Rating | Rank | 7th Grade |
| Spaniards | 62.6 /100 | #163 | Good 96.1% |
| Immigrants | Italy | 62.1 /100 | #164 | Good 96.1% |
| Immigrants | Taiwan | 61.5 /100 | #165 | Good 96.1% |
| Immigrants | Kazakhstan | 61.0 /100 | #166 | Good 96.1% |
| Immigrants | Sri Lanka | 59.9 /100 | #167 | Average 96.1% |
| Immigrants | Poland | 59.0 /100 | #168 | Average 96.1% |
| Ute | 55.8 /100 | #169 | Average 96.1% |
| Immigrants | Ukraine | 55.0 /100 | #170 | Average 96.1% |
| Egyptians | 54.2 /100 | #171 | Average 96.1% |
| Venezuelans | 51.4 /100 | #172 | Average 96.0% |
| Immigrants | Albania | 50.4 /100 | #173 | Average 96.0% |
| Mongolians | 50.0 /100 | #174 | Average 96.0% |
| Blacks/African Americans | 49.5 /100 | #175 | Average 96.0% |
| Chileans | 49.3 /100 | #176 | Average 96.0% |
| Immigrants | Korea | 49.2 /100 | #177 | Average 96.0% |
Demographics Similar to Immigrants from Central America by 7th Grade
In terms of 7th grade, the demographic groups most similar to Immigrants from Central America are Immigrants from El Salvador (90.9%, a difference of 0.060%), Immigrants from Mexico (90.7%, a difference of 0.27%), Immigrants from Guatemala (91.3%, a difference of 0.36%), Salvadoran (91.5%, a difference of 0.52%), and Spanish American Indian (90.3%, a difference of 0.75%).
| Demographics | Rating | Rank | 7th Grade |
| Immigrants | Armenia | 0.0 /100 | #333 | Tragic 92.7% |
| Immigrants | Yemen | 0.0 /100 | #334 | Tragic 92.6% |
| Mexican American Indians | 0.0 /100 | #335 | Tragic 92.6% |
| Immigrants | Honduras | 0.0 /100 | #336 | Tragic 92.5% |
| Immigrants | Latin America | 0.0 /100 | #337 | Tragic 92.2% |
| Central Americans | 0.0 /100 | #338 | Tragic 92.1% |
| Mexicans | 0.0 /100 | #339 | Tragic 91.9% |
| Yakama | 0.0 /100 | #340 | Tragic 91.7% |
| Guatemalans | 0.0 /100 | #341 | Tragic 91.7% |
| Salvadorans | 0.0 /100 | #342 | Tragic 91.5% |
| Immigrants | Guatemala | 0.0 /100 | #343 | Tragic 91.3% |
| Immigrants | Central America | 0.0 /100 | #344 | Tragic 91.0% |
| Immigrants | El Salvador | 0.0 /100 | #345 | Tragic 90.9% |
| Immigrants | Mexico | 0.0 /100 | #346 | Tragic 90.7% |
| Spanish American Indians | 0.0 /100 | #347 | Tragic 90.3% |