Immigrants from Uganda vs Panamanian 6th Grade
COMPARE
Immigrants from Uganda
Panamanian
6th Grade
6th Grade Comparison
Immigrants from Uganda
Panamanians
96.9%
6TH GRADE
21.2/ 100
METRIC RATING
196th/ 347
METRIC RANK
96.9%
6TH GRADE
27.3/ 100
METRIC RATING
191st/ 347
METRIC RANK
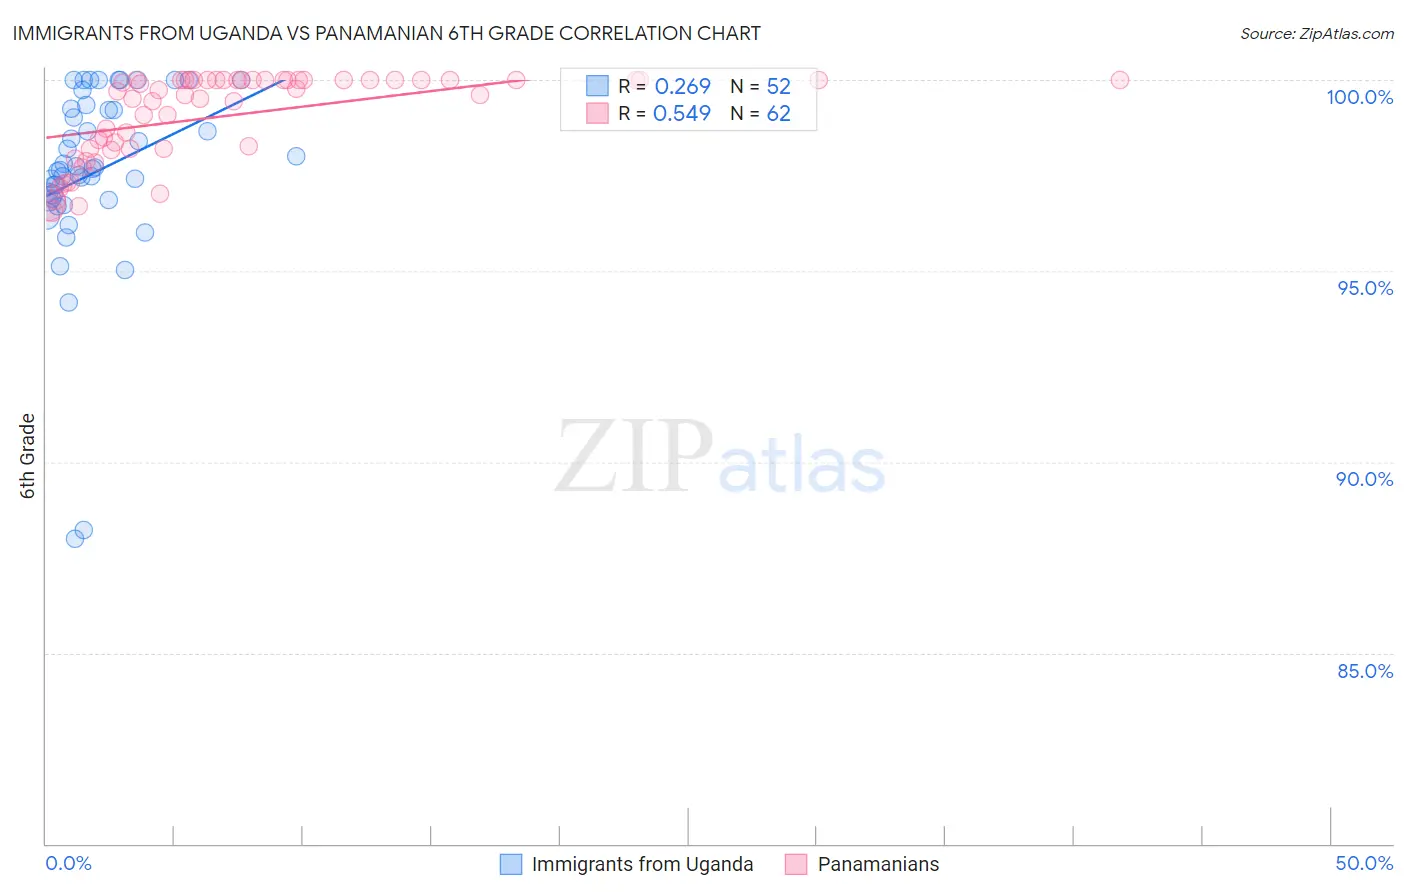
Immigrants from Uganda vs Panamanian 6th Grade Correlation Chart
The statistical analysis conducted on geographies consisting of 125,941,298 people shows a weak positive correlation between the proportion of Immigrants from Uganda and percentage of population with at least 6th grade education in the United States with a correlation coefficient (R) of 0.269 and weighted average of 96.9%. Similarly, the statistical analysis conducted on geographies consisting of 281,248,945 people shows a substantial positive correlation between the proportion of Panamanians and percentage of population with at least 6th grade education in the United States with a correlation coefficient (R) of 0.549 and weighted average of 96.9%, a difference of 0.040%.
6th Grade Correlation Summary
| Measurement | Immigrants from Uganda | Panamanian |
| Minimum | 88.0% | 96.6% |
| Maximum | 100.0% | 100.0% |
| Range | 12.0% | 3.4% |
| Mean | 97.6% | 99.1% |
| Median | 97.7% | 99.6% |
| Interquartile 25% (IQ1) | 96.9% | 98.2% |
| Interquartile 75% (IQ3) | 99.2% | 100.0% |
| Interquartile Range (IQR) | 2.4% | 1.8% |
| Standard Deviation (Sample) | 2.4% | 1.1% |
| Standard Deviation (Population) | 2.4% | 1.1% |
Demographics Similar to Immigrants from Uganda and Panamanians by 6th Grade
In terms of 6th grade, the demographic groups most similar to Immigrants from Uganda are Brazilian (96.9%, a difference of 0.010%), Immigrants from Albania (96.9%, a difference of 0.020%), Paraguayan (96.9%, a difference of 0.030%), Immigrants from Lebanon (96.9%, a difference of 0.030%), and Immigrants from Brazil (96.9%, a difference of 0.030%). Similarly, the demographic groups most similar to Panamanians are Hawaiian (96.9%, a difference of 0.0%), Paraguayan (96.9%, a difference of 0.0%), Dutch West Indian (96.9%, a difference of 0.010%), Immigrants from Lebanon (96.9%, a difference of 0.010%), and Immigrants from Brazil (96.9%, a difference of 0.010%).
| Demographics | Rating | Rank | 6th Grade |
| Immigrants | Venezuela | 34.5 /100 | #183 | Fair 97.0% |
| Spanish Americans | 33.5 /100 | #184 | Fair 97.0% |
| Argentineans | 33.0 /100 | #185 | Fair 97.0% |
| Immigrants | Egypt | 31.4 /100 | #186 | Fair 97.0% |
| Guamanians/Chamorros | 30.6 /100 | #187 | Fair 97.0% |
| Immigrants | Argentina | 30.4 /100 | #188 | Fair 97.0% |
| Blacks/African Americans | 30.2 /100 | #189 | Fair 97.0% |
| Dutch West Indians | 28.3 /100 | #190 | Fair 96.9% |
| Panamanians | 27.3 /100 | #191 | Fair 96.9% |
| Hawaiians | 27.0 /100 | #192 | Fair 96.9% |
| Paraguayans | 26.6 /100 | #193 | Fair 96.9% |
| Immigrants | Lebanon | 25.6 /100 | #194 | Fair 96.9% |
| Immigrants | Brazil | 25.5 /100 | #195 | Fair 96.9% |
| Immigrants | Uganda | 21.2 /100 | #196 | Fair 96.9% |
| Brazilians | 20.1 /100 | #197 | Fair 96.9% |
| Immigrants | Albania | 18.8 /100 | #198 | Poor 96.9% |
| Immigrants | Northern Africa | 15.7 /100 | #199 | Poor 96.9% |
| Africans | 14.8 /100 | #200 | Poor 96.9% |
| Immigrants | Zaire | 14.5 /100 | #201 | Poor 96.9% |
| Immigrants | Chile | 14.2 /100 | #202 | Poor 96.8% |
| Sudanese | 13.9 /100 | #203 | Poor 96.8% |