Immigrants from Uganda vs Immigrants from Western Asia High School Diploma
COMPARE
Immigrants from Uganda
Immigrants from Western Asia
High School Diploma
High School Diploma Comparison
Immigrants from Uganda
Immigrants from Western Asia
88.9%
HIGH SCHOOL DIPLOMA
32.6/ 100
METRIC RATING
189th/ 347
METRIC RANK
89.1%
HIGH SCHOOL DIPLOMA
49.0/ 100
METRIC RATING
175th/ 347
METRIC RANK
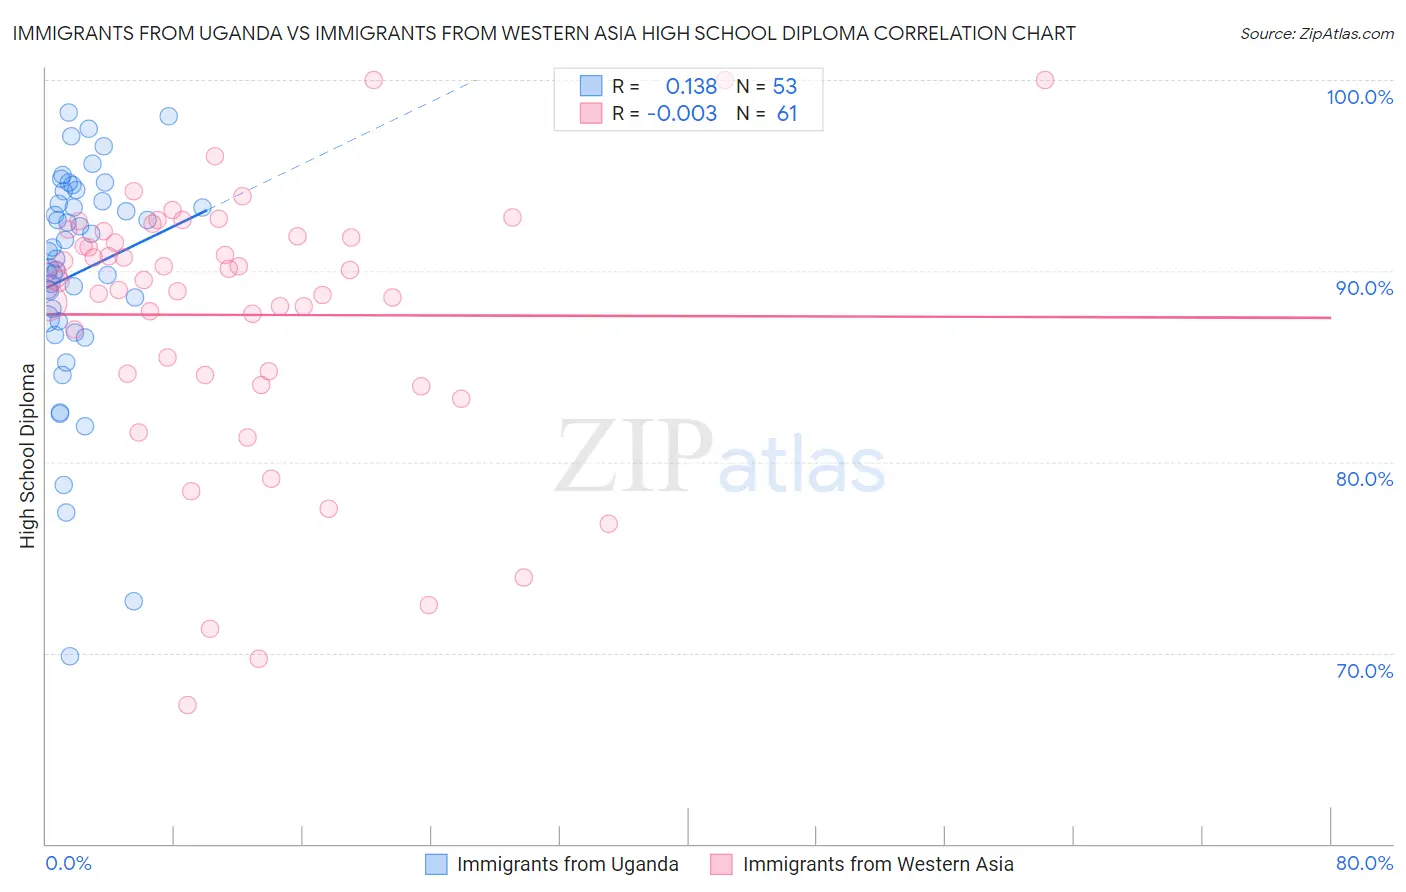
Immigrants from Uganda vs Immigrants from Western Asia High School Diploma Correlation Chart
The statistical analysis conducted on geographies consisting of 125,981,524 people shows a poor positive correlation between the proportion of Immigrants from Uganda and percentage of population with at least high school diploma education in the United States with a correlation coefficient (R) of 0.138 and weighted average of 88.9%. Similarly, the statistical analysis conducted on geographies consisting of 404,433,811 people shows no correlation between the proportion of Immigrants from Western Asia and percentage of population with at least high school diploma education in the United States with a correlation coefficient (R) of -0.003 and weighted average of 89.1%, a difference of 0.26%.
High School Diploma Correlation Summary
| Measurement | Immigrants from Uganda | Immigrants from Western Asia |
| Minimum | 69.8% | 67.2% |
| Maximum | 98.3% | 100.0% |
| Range | 28.5% | 32.8% |
| Mean | 89.9% | 87.7% |
| Median | 91.0% | 89.5% |
| Interquartile 25% (IQ1) | 87.4% | 84.6% |
| Interquartile 75% (IQ3) | 93.9% | 91.9% |
| Interquartile Range (IQR) | 6.5% | 7.4% |
| Standard Deviation (Sample) | 6.0% | 7.0% |
| Standard Deviation (Population) | 5.9% | 7.0% |
Demographics Similar to Immigrants from Uganda and Immigrants from Western Asia by High School Diploma
In terms of high school diploma, the demographic groups most similar to Immigrants from Uganda are Immigrants from Sudan (88.9%, a difference of 0.010%), Immigrants from Chile (88.9%, a difference of 0.010%), Immigrants from Ethiopia (88.9%, a difference of 0.030%), Immigrants from Eastern Africa (88.9%, a difference of 0.050%), and Guamanian/Chamorro (88.9%, a difference of 0.050%). Similarly, the demographic groups most similar to Immigrants from Western Asia are Osage (89.1%, a difference of 0.0%), Sudanese (89.1%, a difference of 0.010%), Sierra Leonean (89.1%, a difference of 0.010%), Immigrants from Indonesia (89.1%, a difference of 0.020%), and Hmong (89.1%, a difference of 0.020%).
| Demographics | Rating | Rank | High School Diploma |
| Immigrants | Nonimmigrants | 51.8 /100 | #172 | Average 89.2% |
| Immigrants | Indonesia | 50.3 /100 | #173 | Average 89.1% |
| Hmong | 50.0 /100 | #174 | Average 89.1% |
| Immigrants | Western Asia | 49.0 /100 | #175 | Average 89.1% |
| Osage | 48.9 /100 | #176 | Average 89.1% |
| Sudanese | 48.5 /100 | #177 | Average 89.1% |
| Sierra Leoneans | 48.4 /100 | #178 | Average 89.1% |
| Americans | 47.2 /100 | #179 | Average 89.1% |
| Bolivians | 45.2 /100 | #180 | Average 89.1% |
| Venezuelans | 43.6 /100 | #181 | Average 89.1% |
| Spaniards | 43.4 /100 | #182 | Average 89.1% |
| Potawatomi | 42.5 /100 | #183 | Average 89.0% |
| Immigrants | Syria | 39.2 /100 | #184 | Fair 89.0% |
| Ethiopians | 37.0 /100 | #185 | Fair 89.0% |
| Immigrants | Eastern Africa | 35.8 /100 | #186 | Fair 88.9% |
| Guamanians/Chamorros | 35.5 /100 | #187 | Fair 88.9% |
| Immigrants | Sudan | 33.4 /100 | #188 | Fair 88.9% |
| Immigrants | Uganda | 32.6 /100 | #189 | Fair 88.9% |
| Immigrants | Chile | 31.9 /100 | #190 | Fair 88.9% |
| Immigrants | Ethiopia | 30.9 /100 | #191 | Fair 88.9% |
| Moroccans | 29.5 /100 | #192 | Fair 88.8% |