Immigrants from Turkey vs Native Hawaiian Nursery School
COMPARE
Immigrants from Turkey
Native Hawaiian
Nursery School
Nursery School Comparison
Immigrants from Turkey
Native Hawaiians
98.1%
NURSERY SCHOOL
83.0/ 100
METRIC RATING
141st/ 347
METRIC RANK
98.5%
NURSERY SCHOOL
99.9/ 100
METRIC RATING
43rd/ 347
METRIC RANK
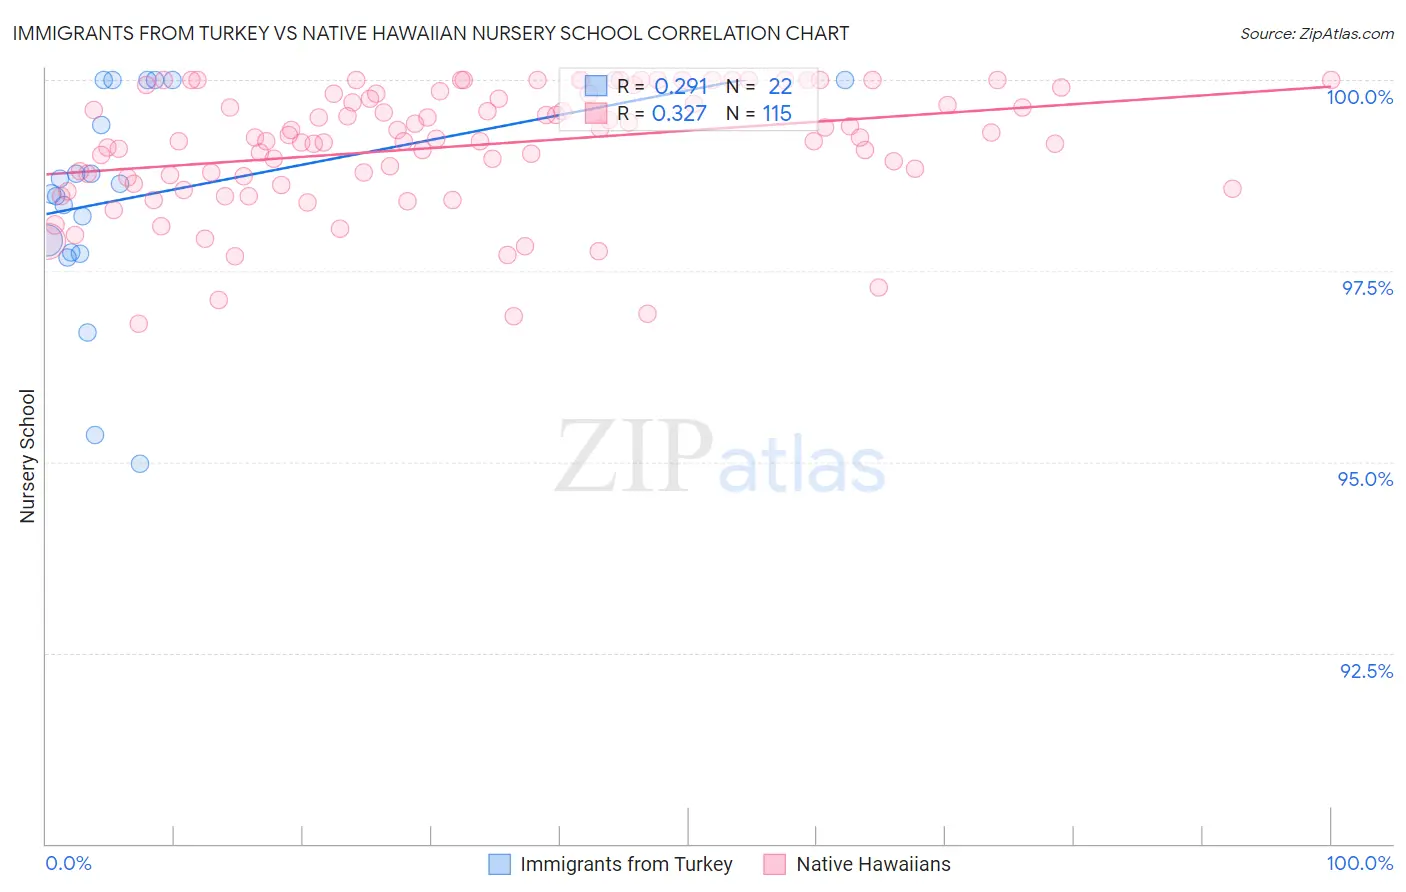
Immigrants from Turkey vs Native Hawaiian Nursery School Correlation Chart
The statistical analysis conducted on geographies consisting of 223,057,877 people shows a weak positive correlation between the proportion of Immigrants from Turkey and percentage of population with at least nursery school education in the United States with a correlation coefficient (R) of 0.291 and weighted average of 98.1%. Similarly, the statistical analysis conducted on geographies consisting of 332,114,626 people shows a mild positive correlation between the proportion of Native Hawaiians and percentage of population with at least nursery school education in the United States with a correlation coefficient (R) of 0.327 and weighted average of 98.5%, a difference of 0.41%.
Nursery School Correlation Summary
| Measurement | Immigrants from Turkey | Native Hawaiian |
| Minimum | 95.0% | 96.8% |
| Maximum | 100.0% | 100.0% |
| Range | 5.0% | 3.2% |
| Mean | 98.5% | 99.1% |
| Median | 98.6% | 99.2% |
| Interquartile 25% (IQ1) | 97.7% | 98.7% |
| Interquartile 75% (IQ3) | 100.0% | 99.8% |
| Interquartile Range (IQR) | 2.3% | 1.1% |
| Standard Deviation (Sample) | 1.4% | 0.79% |
| Standard Deviation (Population) | 1.4% | 0.78% |
Similar Demographics by Nursery School
Demographics Similar to Immigrants from Turkey by Nursery School
In terms of nursery school, the demographic groups most similar to Immigrants from Turkey are Palestinian (98.1%, a difference of 0.0%), Burmese (98.1%, a difference of 0.010%), Marshallese (98.1%, a difference of 0.010%), Alsatian (98.1%, a difference of 0.010%), and Immigrants from Israel (98.1%, a difference of 0.020%).
| Demographics | Rating | Rank | Nursery School |
| Immigrants | Bulgaria | 89.4 /100 | #134 | Excellent 98.1% |
| Immigrants | Hungary | 89.3 /100 | #135 | Excellent 98.1% |
| Immigrants | Kuwait | 88.9 /100 | #136 | Excellent 98.1% |
| Israelis | 88.2 /100 | #137 | Excellent 98.1% |
| Immigrants | Romania | 88.0 /100 | #138 | Excellent 98.1% |
| Blackfeet | 87.5 /100 | #139 | Excellent 98.1% |
| Palestinians | 83.7 /100 | #140 | Excellent 98.1% |
| Immigrants | Turkey | 83.0 /100 | #141 | Excellent 98.1% |
| Burmese | 81.7 /100 | #142 | Excellent 98.1% |
| Marshallese | 81.2 /100 | #143 | Excellent 98.1% |
| Alsatians | 80.3 /100 | #144 | Excellent 98.1% |
| Immigrants | Israel | 78.5 /100 | #145 | Good 98.1% |
| Filipinos | 78.5 /100 | #146 | Good 98.1% |
| Hmong | 75.7 /100 | #147 | Good 98.1% |
| Immigrants | Greece | 75.4 /100 | #148 | Good 98.1% |
Demographics Similar to Native Hawaiians by Nursery School
In terms of nursery school, the demographic groups most similar to Native Hawaiians are Eastern European (98.5%, a difference of 0.0%), Luxembourger (98.5%, a difference of 0.010%), Belgian (98.5%, a difference of 0.010%), Northern European (98.5%, a difference of 0.010%), and Lumbee (98.5%, a difference of 0.020%).
| Demographics | Rating | Rank | Nursery School |
| British | 100.0 /100 | #36 | Exceptional 98.5% |
| Lumbee | 99.9 /100 | #37 | Exceptional 98.5% |
| Italians | 99.9 /100 | #38 | Exceptional 98.5% |
| Latvians | 99.9 /100 | #39 | Exceptional 98.5% |
| Chippewa | 99.9 /100 | #40 | Exceptional 98.5% |
| Luxembourgers | 99.9 /100 | #41 | Exceptional 98.5% |
| Eastern Europeans | 99.9 /100 | #42 | Exceptional 98.5% |
| Native Hawaiians | 99.9 /100 | #43 | Exceptional 98.5% |
| Belgians | 99.9 /100 | #44 | Exceptional 98.5% |
| Northern Europeans | 99.9 /100 | #45 | Exceptional 98.5% |
| Hungarians | 99.9 /100 | #46 | Exceptional 98.5% |
| Czechoslovakians | 99.9 /100 | #47 | Exceptional 98.5% |
| Ottawa | 99.8 /100 | #48 | Exceptional 98.5% |
| Whites/Caucasians | 99.8 /100 | #49 | Exceptional 98.5% |
| Celtics | 99.8 /100 | #50 | Exceptional 98.5% |