Immigrants from Turkey vs Japanese 4th Grade

COMPARE

Immigrants from Turkey
Race
Ancestry
AfghanAfricanAlaska NativeAlaskan AthabascanAlbanianAleutAlsatianAmericanApacheArabArapahoArgentineanArmenianAssyrian/Chaldean/SyriacAustralianAustrianBahamianBangladeshiBarbadianBasqueBelgianBelizeanBermudanBhutaneseBlackfeetBolivianBrazilianBritishBritish West IndianBulgarianBurmeseCajunCambodianCanadianCape VerdeanCarpatho RusynCelticCentral AmericanCentral American IndianCherokeeCheyenneChickasawChileanChineseChippewaChoctawColombianColvilleComancheCosta RicanCreeCreekCroatianCrowCubanCypriotCzechCzechoslovakianDanishDelawareDominicanDutchDutch West IndianEastern EuropeanEcuadorianEgyptianEnglishEstonianEthiopianEuropeanFijianFilipinoFinnishFrenchFrench American IndianFrench CanadianGermanGerman RussianGhanaianGreekGuamanian/ChamorroGuatemalanGuyaneseHaitianHmongHonduranHopiHoumaHungarianIcelanderIndian (Asian)IndonesianInupiatIranianIraqiIrishIroquoisIsraeliItalianJamaicanJordanianKenyanKiowaKoreanLaotianLatvianLebaneseLiberianLithuanianLumbeeLuxembourgerMacedonianMalaysianMalteseMarshalleseMenomineeMexicanMexican American IndianMongolianMoroccanNative HawaiianNavajoNepaleseNew ZealanderNicaraguanNigerianNorthern EuropeanNorwegianOkinawanOsageOttawaPaiutePakistaniPalestinianPanamanianParaguayanPennsylvania GermanPeruvianPimaPolishPortuguesePotawatomiPuebloPuerto RicanPuget Sound SalishRomanianRussianSalvadoranSamoanScandinavianScotch-IrishScottishSeminoleSenegaleseSerbianShoshoneSierra LeoneanSiouxSlavicSlovakSloveneSomaliSouth AfricanSouth AmericanSouth American IndianSoviet UnionSpaniardSpanishSpanish AmericanSpanish American IndianSri LankanSubsaharan AfricanSudaneseSwedishSwissSyrianTaiwaneseThaiTlingit-HaidaTohono O'OdhamTonganTrinidadian and TobagonianTsimshianTurkishU.S. Virgin IslanderUgandanUkrainianUruguayanUteVenezuelanVietnameseWelshWest IndianYakamaYaquiYugoslavianYumanYup'ikZimbabwean
Immigration
NonimmigrantsImmigrantsAfghanistanAfricaAlbaniaArgentinaArmeniaAsiaAustraliaAustriaBahamasBangladeshBarbadosBelarusBelgiumBelizeBoliviaBosnia and HerzegovinaBrazilBulgariaBurma/MyanmarCabo VerdeCambodiaCameroonCanadaCaribbeanCentral AmericaChileChinaColombiaCongoCosta RicaCroatiaCubaCzechoslovakiaDenmarkDominicaDominican RepublicEastern AfricaEastern AsiaEastern EuropeEcuadorEgyptEl SalvadorEnglandEritreaEthiopiaEuropeFijiFranceGermanyGhanaGreeceGrenadaGuatemalaGuyanaHaitiHondurasHong KongHungaryIndiaIndonesiaIranIraqIrelandIsraelItalyJamaicaJapanJordanKazakhstanKenyaKoreaKuwaitLaosLatin AmericaLatviaLebanonLiberiaLithuaniaMalaysiaMexicoMicronesiaMiddle AfricaMoldovaMoroccoNepalNetherlandsNicaraguaNigeriaNorth AmericaNorth MacedoniaNorthern AfricaNorthern EuropeNorwayOceaniaPakistanPanamaPeruPhilippinesPolandPortugalRomaniaRussiaSaudi ArabiaScotlandSenegalSerbiaSierra LeoneSingaporeSomaliaSouth AfricaSouth AmericaSouth Central AsiaSouth Eastern AsiaSouthern EuropeSpainSri LankaSt. Vincent and the GrenadinesSudanSwedenSwitzerlandSyriaTaiwanThailandTrinidad and TobagoTurkeyUgandaUkraineUruguayUzbekistanVenezuelaVietnamWest IndiesWestern AfricaWestern AsiaWestern EuropeYemenZaireZimbabweAzores
Japanese
Race
Ancestry
AfghanAfricanAlaska NativeAlaskan AthabascanAlbanianAleutAlsatianAmericanApacheArabArapahoArgentineanArmenianAssyrian/Chaldean/SyriacAustralianAustrianBahamianBangladeshiBarbadianBasqueBelgianBelizeanBermudanBhutaneseBlackfeetBolivianBrazilianBritishBritish West IndianBulgarianBurmeseCajunCambodianCanadianCape VerdeanCarpatho RusynCelticCentral AmericanCentral American IndianCherokeeCheyenneChickasawChileanChineseChippewaChoctawColombianColvilleComancheCosta RicanCreeCreekCroatianCrowCubanCypriotCzechCzechoslovakianDanishDelawareDominicanDutchDutch West IndianEastern EuropeanEcuadorianEgyptianEnglishEstonianEthiopianEuropeanFijianFilipinoFinnishFrenchFrench American IndianFrench CanadianGermanGerman RussianGhanaianGreekGuamanian/ChamorroGuatemalanGuyaneseHaitianHmongHonduranHopiHoumaHungarianIcelanderIndian (Asian)IndonesianInupiatIranianIraqiIrishIroquoisIsraeliItalianJamaicanJapaneseJordanianKenyanKiowaKoreanLaotianLatvianLebaneseLiberianLithuanianLumbeeLuxembourgerMacedonianMalaysianMalteseMarshalleseMenomineeMexicanMexican American IndianMongolianMoroccanNative HawaiianNavajoNepaleseNew ZealanderNicaraguanNigerianNorthern EuropeanNorwegianOkinawanOsageOttawaPaiutePakistaniPalestinianPanamanianParaguayanPennsylvania GermanPeruvianPimaPolishPortuguesePotawatomiPuebloPuerto RicanPuget Sound SalishRomanianRussianSalvadoranSamoanScandinavianScotch-IrishScottishSeminoleSenegaleseSerbianShoshoneSierra LeoneanSiouxSlavicSlovakSloveneSomaliSouth AfricanSouth AmericanSouth American IndianSoviet UnionSpaniardSpanishSpanish AmericanSpanish American IndianSri LankanSubsaharan AfricanSudaneseSwedishSwissSyrianTaiwaneseThaiTlingit-HaidaTohono O'OdhamTonganTrinidadian and TobagonianTsimshianTurkishU.S. Virgin IslanderUgandanUkrainianUruguayanUteVenezuelanVietnameseWelshWest IndianYakamaYaquiYugoslavianYumanYup'ikZimbabwean
Immigration
NonimmigrantsImmigrantsAfghanistanAfricaAlbaniaArgentinaArmeniaAsiaAustraliaAustriaBahamasBangladeshBarbadosBelarusBelgiumBelizeBoliviaBosnia and HerzegovinaBrazilBulgariaBurma/MyanmarCabo VerdeCambodiaCameroonCanadaCaribbeanCentral AmericaChileChinaColombiaCongoCosta RicaCroatiaCubaCzechoslovakiaDenmarkDominicaDominican RepublicEastern AfricaEastern AsiaEastern EuropeEcuadorEgyptEl SalvadorEnglandEritreaEthiopiaEuropeFijiFranceGermanyGhanaGreeceGrenadaGuatemalaGuyanaHaitiHondurasHong KongHungaryIndiaIndonesiaIranIraqIrelandIsraelItalyJamaicaJapanJordanKazakhstanKenyaKoreaKuwaitLaosLatin AmericaLatviaLebanonLiberiaLithuaniaMalaysiaMexicoMicronesiaMiddle AfricaMoldovaMoroccoNepalNetherlandsNicaraguaNigeriaNorth AmericaNorth MacedoniaNorthern AfricaNorthern EuropeNorwayOceaniaPakistanPanamaPeruPhilippinesPolandPortugalRomaniaRussiaSaudi ArabiaScotlandSenegalSerbiaSierra LeoneSingaporeSomaliaSouth AfricaSouth AmericaSouth Central AsiaSouth Eastern AsiaSouthern EuropeSpainSri LankaSt. Vincent and the GrenadinesSudanSwedenSwitzerlandSyriaTaiwanThailandTrinidad and TobagoUgandaUkraineUruguayUzbekistanVenezuelaVietnamWest IndiesWestern AfricaWestern AsiaWestern EuropeYemenZaireZimbabweAzores
4th Grade
Income
Poverty
Unemployment
Labor Participation
Family Structure
Vehicle Availability
Education Level
Disability

4th Grade Comparison

Immigrants from Turkey

Japanese

Excellent
Tragic
97.7%
4TH GRADE
86.0/ 100
METRIC RATING
137th/ 347
METRIC RANK
96.0%
4TH GRADE
0.0/ 100
METRIC RATING
321st/ 347
METRIC RANK

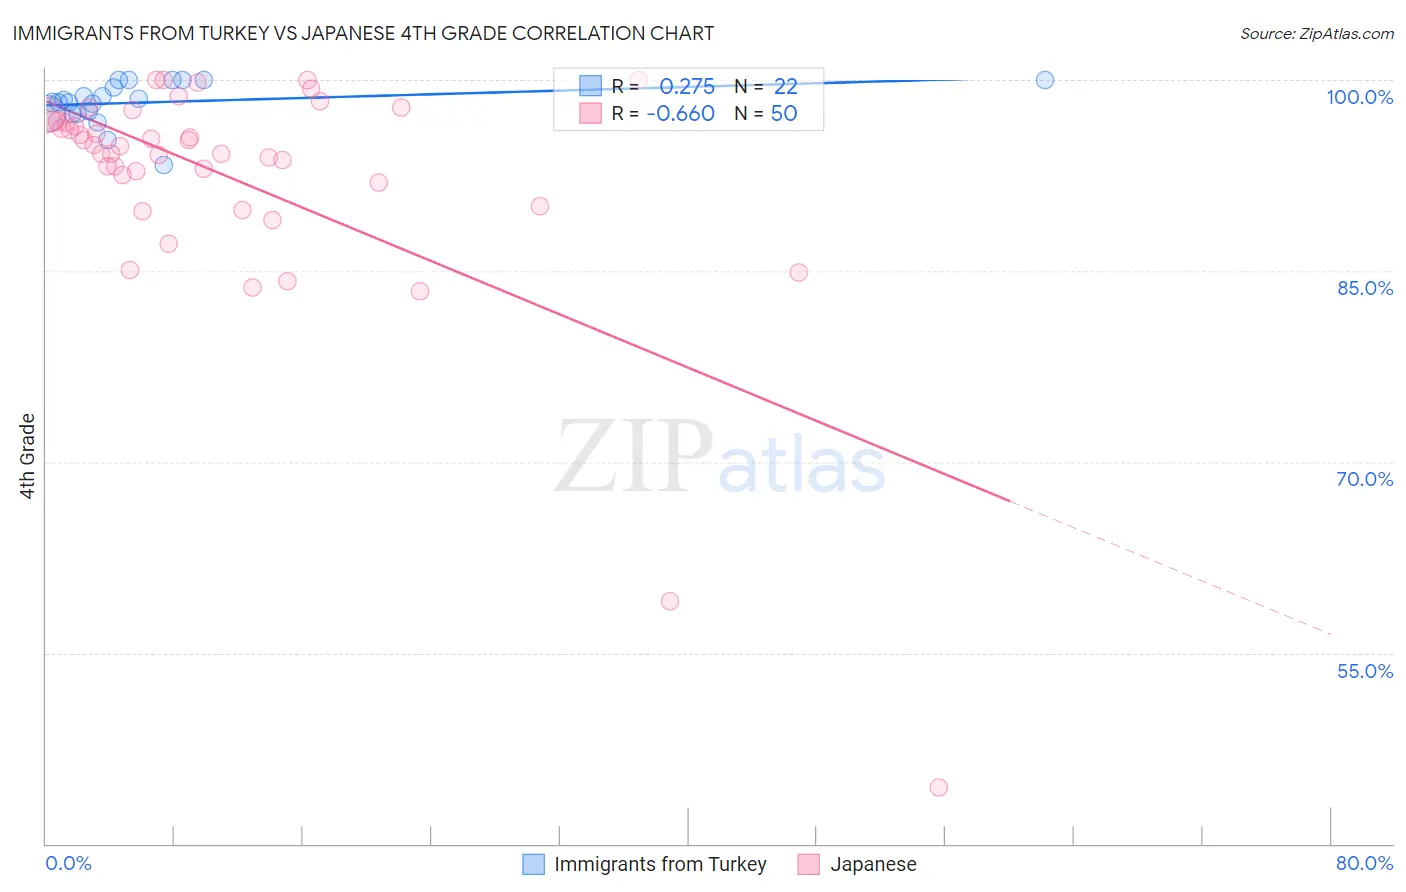
Immigrants from Turkey vs Japanese 4th Grade Correlation Chart

The statistical analysis conducted on geographies consisting of 223,057,877 people shows a weak positive correlation between the proportion of Immigrants from Turkey and percentage of population with at least 4th grade education in the United States with a correlation coefficient (R) of 0.275 and weighted average of 97.7%. Similarly, the statistical analysis conducted on geographies consisting of 249,183,224 people shows a significant negative correlation between the proportion of Japanese and percentage of population with at least 4th grade education in the United States with a correlation coefficient (R) of -0.660 and weighted average of 96.0%, a difference of 1.7%.
Immigrants from Turkey vs Japanese 4th Grade

4th Grade Correlation Summary

MeasurementImmigrants from TurkeyJapanese
Minimum93.3%44.4%
Maximum100.0%100.0%
Range6.7%55.6%
Mean98.2%92.4%
Median98.3%94.8%
Interquartile 25% (IQ1)97.4%92.0%
Interquartile 75% (IQ3)100.0%96.7%
Interquartile Range (IQR)2.6%4.8%
Standard Deviation (Sample)1.7%9.6%
Standard Deviation (Population)1.6%9.5%

Similar Demographics by 4th Grade

Demographics Similar to Immigrants from Turkey by 4th Grade

In terms of 4th grade, the demographic groups most similar to Immigrants from Turkey are Israeli (97.7%, a difference of 0.0%), Blackfeet (97.7%, a difference of 0.0%), Seminole (97.7%, a difference of 0.010%), Filipino (97.7%, a difference of 0.010%), and Hmong (97.7%, a difference of 0.020%).
DemographicsRating | Rank4th Grade
Immigrants | Romania
90.6
/100
|
#130
Exceptional
97.7%
Immigrants | Kuwait
89.7
/100
|
#131
Excellent
97.7%
Immigrants | Hungary
89.3
/100
|
#132
Excellent
97.7%
Hmong
88.2
/100
|
#133
Excellent
97.7%
Palestinians
88.1
/100
|
#134
Excellent
97.7%
Cambodians
87.8
/100
|
#135
Excellent
97.7%
Israelis
86.2
/100
|
#136
Excellent
97.7%
Immigrants | Turkey
86.0
/100
|
#137
Excellent
97.7%
Blackfeet
86.0
/100
|
#138
Excellent
97.7%
Seminole
84.7
/100
|
#139
Excellent
97.7%
Filipinos
84.0
/100
|
#140
Excellent
97.7%
Immigrants | Greece
83.8
/100
|
#141
Excellent
97.7%
Immigrants | North Macedonia
83.3
/100
|
#142
Excellent
97.7%
Burmese
82.8
/100
|
#143
Excellent
97.7%
Spaniards
82.7
/100
|
#144
Excellent
97.7%

Demographics Similar to Japanese by 4th Grade

In terms of 4th grade, the demographic groups most similar to Japanese are Immigrants from Vietnam (96.0%, a difference of 0.0%), Immigrants from Nicaragua (96.0%, a difference of 0.020%), Immigrants from Belize (96.0%, a difference of 0.030%), Dominican (96.0%, a difference of 0.040%), and Hispanic or Latino (96.0%, a difference of 0.050%).
DemographicsRating | Rank4th Grade
Vietnamese
0.0
/100
|
#314
Tragic
96.2%
Nicaraguans
0.0
/100
|
#315
Tragic
96.2%
Immigrants | Ecuador
0.0
/100
|
#316
Tragic
96.2%
Central American Indians
0.0
/100
|
#317
Tragic
96.2%
Immigrants | Azores
0.0
/100
|
#318
Tragic
96.1%
Belizeans
0.0
/100
|
#319
Tragic
96.1%
Bangladeshis
0.0
/100
|
#320
Tragic
96.1%
Japanese
0.0
/100
|
#321
Tragic
96.0%
Immigrants | Vietnam
0.0
/100
|
#322
Tragic
96.0%
Immigrants | Nicaragua
0.0
/100
|
#323
Tragic
96.0%
Immigrants | Belize
0.0
/100
|
#324
Tragic
96.0%
Dominicans
0.0
/100
|
#325
Tragic
96.0%
Hispanics or Latinos
0.0
/100
|
#326
Tragic
96.0%
Hondurans
0.0
/100
|
#327
Tragic
96.0%
Mexican American Indians
0.0
/100
|
#328
Tragic
95.8%