Immigrants from Turkey vs Immigrants from West Indies 10th Grade
COMPARE
Immigrants from Turkey
Immigrants from West Indies
10th Grade
10th Grade Comparison
Immigrants from Turkey
Immigrants from West Indies
94.5%
10TH GRADE
97.4/ 100
METRIC RATING
105th/ 347
METRIC RANK
91.8%
10TH GRADE
0.0/ 100
METRIC RATING
291st/ 347
METRIC RANK
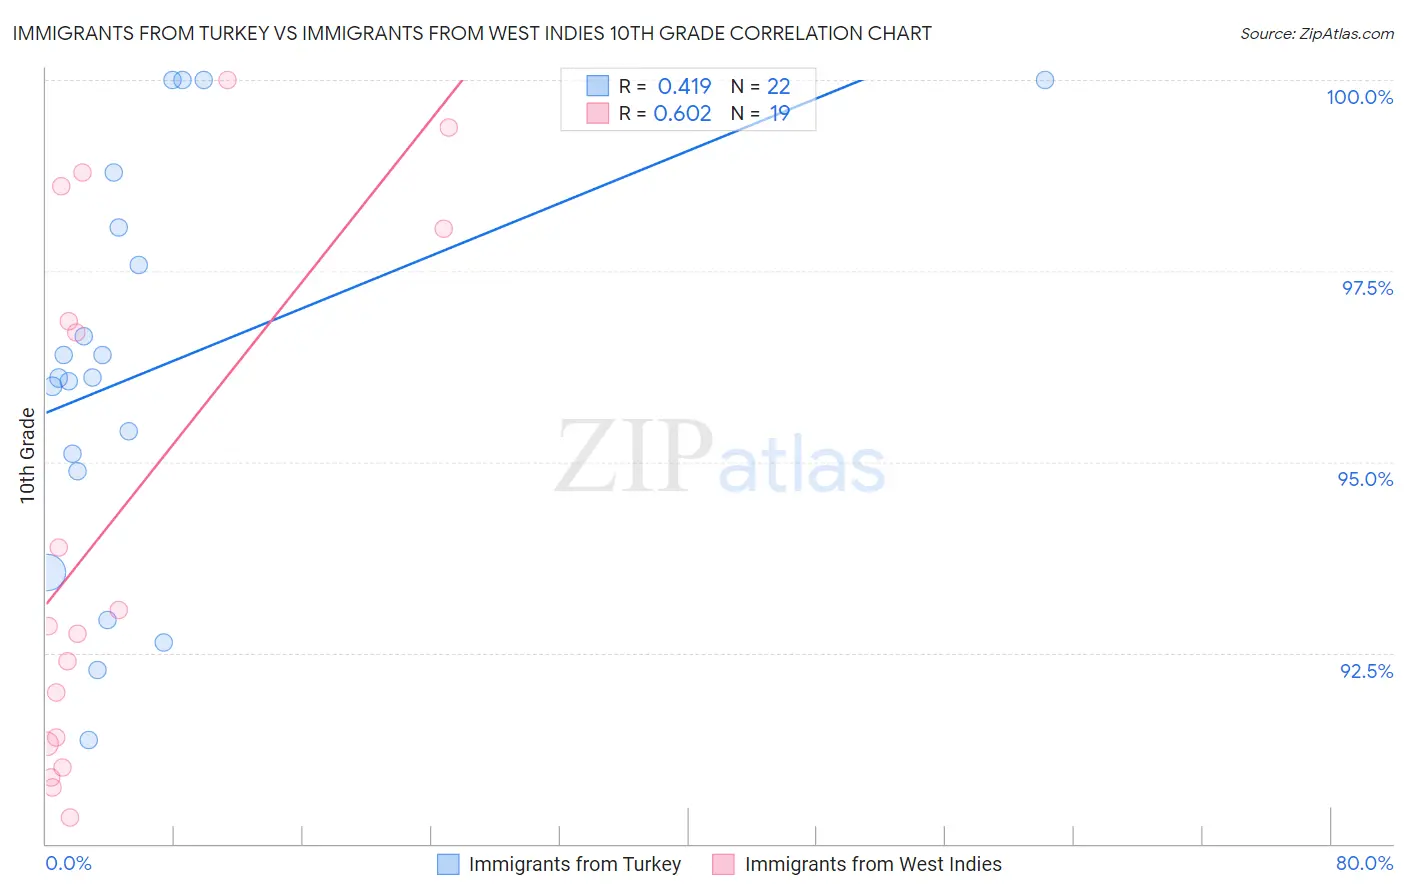
Immigrants from Turkey vs Immigrants from West Indies 10th Grade Correlation Chart
The statistical analysis conducted on geographies consisting of 223,057,877 people shows a moderate positive correlation between the proportion of Immigrants from Turkey and percentage of population with at least 10th grade education in the United States with a correlation coefficient (R) of 0.419 and weighted average of 94.5%. Similarly, the statistical analysis conducted on geographies consisting of 72,457,514 people shows a significant positive correlation between the proportion of Immigrants from West Indies and percentage of population with at least 10th grade education in the United States with a correlation coefficient (R) of 0.602 and weighted average of 91.8%, a difference of 2.9%.
10th Grade Correlation Summary
| Measurement | Immigrants from Turkey | Immigrants from West Indies |
| Minimum | 91.4% | 90.4% |
| Maximum | 100.0% | 100.0% |
| Range | 8.6% | 9.6% |
| Mean | 96.2% | 94.3% |
| Median | 96.1% | 92.8% |
| Interquartile 25% (IQ1) | 94.9% | 91.3% |
| Interquartile 75% (IQ3) | 98.1% | 98.0% |
| Interquartile Range (IQR) | 3.2% | 6.7% |
| Standard Deviation (Sample) | 2.6% | 3.4% |
| Standard Deviation (Population) | 2.6% | 3.3% |
Similar Demographics by 10th Grade
Demographics Similar to Immigrants from Turkey by 10th Grade
In terms of 10th grade, the demographic groups most similar to Immigrants from Turkey are Immigrants from Romania (94.5%, a difference of 0.0%), Immigrants from Serbia (94.5%, a difference of 0.0%), Immigrants from Croatia (94.5%, a difference of 0.0%), Immigrants from Europe (94.5%, a difference of 0.010%), and Cambodian (94.5%, a difference of 0.020%).
| Demographics | Rating | Rank | 10th Grade |
| Immigrants | Bulgaria | 98.1 /100 | #98 | Exceptional 94.6% |
| Immigrants | France | 97.9 /100 | #99 | Exceptional 94.5% |
| Immigrants | South Central Asia | 97.8 /100 | #100 | Exceptional 94.5% |
| Syrians | 97.7 /100 | #101 | Exceptional 94.5% |
| Cambodians | 97.6 /100 | #102 | Exceptional 94.5% |
| Immigrants | Europe | 97.5 /100 | #103 | Exceptional 94.5% |
| Immigrants | Romania | 97.5 /100 | #104 | Exceptional 94.5% |
| Immigrants | Turkey | 97.4 /100 | #105 | Exceptional 94.5% |
| Immigrants | Serbia | 97.4 /100 | #106 | Exceptional 94.5% |
| Immigrants | Croatia | 97.4 /100 | #107 | Exceptional 94.5% |
| Immigrants | North Macedonia | 97.2 /100 | #108 | Exceptional 94.5% |
| Immigrants | Norway | 97.2 /100 | #109 | Exceptional 94.5% |
| Burmese | 97.1 /100 | #110 | Exceptional 94.5% |
| Immigrants | Zimbabwe | 96.8 /100 | #111 | Exceptional 94.4% |
| Immigrants | Kuwait | 96.8 /100 | #112 | Exceptional 94.4% |
Demographics Similar to Immigrants from West Indies by 10th Grade
In terms of 10th grade, the demographic groups most similar to Immigrants from West Indies are British West Indian (91.8%, a difference of 0.0%), Immigrants from Burma/Myanmar (91.8%, a difference of 0.0%), Indonesian (91.8%, a difference of 0.020%), Sri Lankan (91.8%, a difference of 0.030%), and Pennsylvania German (91.9%, a difference of 0.060%).
| Demographics | Rating | Rank | 10th Grade |
| Immigrants | Barbados | 0.0 /100 | #284 | Tragic 92.1% |
| Immigrants | South Eastern Asia | 0.0 /100 | #285 | Tragic 92.1% |
| Yuman | 0.0 /100 | #286 | Tragic 92.0% |
| Pennsylvania Germans | 0.0 /100 | #287 | Tragic 91.9% |
| Immigrants | Laos | 0.0 /100 | #288 | Tragic 91.9% |
| Sri Lankans | 0.0 /100 | #289 | Tragic 91.8% |
| British West Indians | 0.0 /100 | #290 | Tragic 91.8% |
| Immigrants | West Indies | 0.0 /100 | #291 | Tragic 91.8% |
| Immigrants | Burma/Myanmar | 0.0 /100 | #292 | Tragic 91.8% |
| Indonesians | 0.0 /100 | #293 | Tragic 91.8% |
| Haitians | 0.0 /100 | #294 | Tragic 91.8% |
| Lumbee | 0.0 /100 | #295 | Tragic 91.7% |
| Immigrants | Grenada | 0.0 /100 | #296 | Tragic 91.6% |
| Fijians | 0.0 /100 | #297 | Tragic 91.5% |
| Cubans | 0.0 /100 | #298 | Tragic 91.5% |