Immigrants from Turkey vs Immigrants from Jordan Doctorate Degree
COMPARE
Immigrants from Turkey
Immigrants from Jordan
Doctorate Degree
Doctorate Degree Comparison
Immigrants from Turkey
Immigrants from Jordan
2.6%
DOCTORATE DEGREE
100.0/ 100
METRIC RATING
27th/ 347
METRIC RANK
2.0%
DOCTORATE DEGREE
94.8/ 100
METRIC RATING
121st/ 347
METRIC RANK
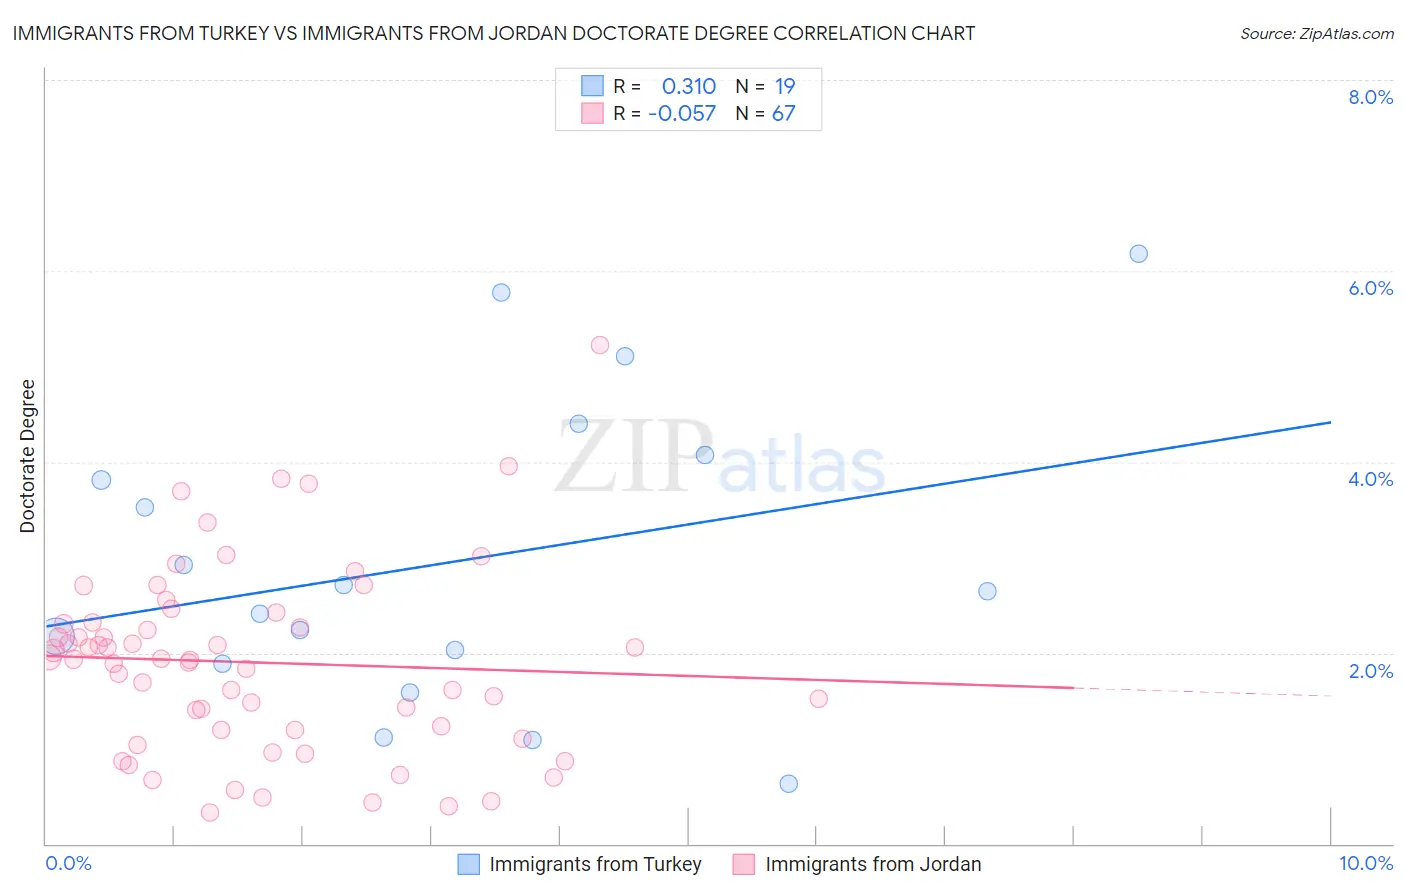
Immigrants from Turkey vs Immigrants from Jordan Doctorate Degree Correlation Chart
The statistical analysis conducted on geographies consisting of 222,587,389 people shows a mild positive correlation between the proportion of Immigrants from Turkey and percentage of population with at least doctorate degree education in the United States with a correlation coefficient (R) of 0.310 and weighted average of 2.6%. Similarly, the statistical analysis conducted on geographies consisting of 180,883,250 people shows a slight negative correlation between the proportion of Immigrants from Jordan and percentage of population with at least doctorate degree education in the United States with a correlation coefficient (R) of -0.057 and weighted average of 2.0%, a difference of 29.9%.
Doctorate Degree Correlation Summary
| Measurement | Immigrants from Turkey | Immigrants from Jordan |
| Minimum | 0.63% | 0.32% |
| Maximum | 6.2% | 5.2% |
| Range | 5.6% | 4.9% |
| Mean | 3.0% | 1.9% |
| Median | 2.6% | 1.9% |
| Interquartile 25% (IQ1) | 1.9% | 1.2% |
| Interquartile 75% (IQ3) | 4.1% | 2.3% |
| Interquartile Range (IQR) | 2.2% | 1.1% |
| Standard Deviation (Sample) | 1.6% | 0.98% |
| Standard Deviation (Population) | 1.5% | 0.97% |
Similar Demographics by Doctorate Degree
Demographics Similar to Immigrants from Turkey by Doctorate Degree
In terms of doctorate degree, the demographic groups most similar to Immigrants from Turkey are Burmese (2.6%, a difference of 0.30%), Immigrants from South Central Asia (2.6%, a difference of 0.57%), Immigrants from Korea (2.6%, a difference of 0.61%), Turkish (2.7%, a difference of 0.87%), and Immigrants from Saudi Arabia (2.7%, a difference of 1.4%).
| Demographics | Rating | Rank | Doctorate Degree |
| Immigrants | Hong Kong | 100.0 /100 | #20 | Exceptional 2.8% |
| Thais | 100.0 /100 | #21 | Exceptional 2.8% |
| Mongolians | 100.0 /100 | #22 | Exceptional 2.8% |
| Immigrants | Denmark | 100.0 /100 | #23 | Exceptional 2.8% |
| Israelis | 100.0 /100 | #24 | Exceptional 2.7% |
| Immigrants | Saudi Arabia | 100.0 /100 | #25 | Exceptional 2.7% |
| Turks | 100.0 /100 | #26 | Exceptional 2.7% |
| Immigrants | Turkey | 100.0 /100 | #27 | Exceptional 2.6% |
| Burmese | 100.0 /100 | #28 | Exceptional 2.6% |
| Immigrants | South Central Asia | 100.0 /100 | #29 | Exceptional 2.6% |
| Immigrants | Korea | 100.0 /100 | #30 | Exceptional 2.6% |
| Latvians | 100.0 /100 | #31 | Exceptional 2.6% |
| Immigrants | Northern Europe | 100.0 /100 | #32 | Exceptional 2.6% |
| Cambodians | 100.0 /100 | #33 | Exceptional 2.6% |
| Cypriots | 100.0 /100 | #34 | Exceptional 2.6% |
Demographics Similar to Immigrants from Jordan by Doctorate Degree
In terms of doctorate degree, the demographic groups most similar to Immigrants from Jordan are Immigrants from Southern Europe (2.0%, a difference of 0.030%), Immigrants from Morocco (2.0%, a difference of 0.48%), Croatian (2.0%, a difference of 0.48%), Pakistani (2.0%, a difference of 0.76%), and Icelander (2.1%, a difference of 0.90%).
| Demographics | Rating | Rank | Doctorate Degree |
| Immigrants | Croatia | 96.8 /100 | #114 | Exceptional 2.1% |
| Taiwanese | 96.7 /100 | #115 | Exceptional 2.1% |
| Maltese | 96.2 /100 | #116 | Exceptional 2.1% |
| Lebanese | 96.0 /100 | #117 | Exceptional 2.1% |
| Icelanders | 96.0 /100 | #118 | Exceptional 2.1% |
| Pakistanis | 95.8 /100 | #119 | Exceptional 2.0% |
| Immigrants | Morocco | 95.5 /100 | #120 | Exceptional 2.0% |
| Immigrants | Jordan | 94.8 /100 | #121 | Exceptional 2.0% |
| Immigrants | Southern Europe | 94.7 /100 | #122 | Exceptional 2.0% |
| Croatians | 94.0 /100 | #123 | Exceptional 2.0% |
| Ute | 93.2 /100 | #124 | Exceptional 2.0% |
| Moroccans | 93.0 /100 | #125 | Exceptional 2.0% |
| Jordanians | 92.1 /100 | #126 | Exceptional 2.0% |
| Palestinians | 92.0 /100 | #127 | Exceptional 2.0% |
| Immigrants | Zaire | 91.1 /100 | #128 | Exceptional 2.0% |