Immigrants from Turkey vs Costa Rican 3rd Grade
COMPARE
Immigrants from Turkey
Costa Rican
3rd Grade
3rd Grade Comparison
Immigrants from Turkey
Costa Ricans
97.9%
3RD GRADE
83.5/ 100
METRIC RATING
141st/ 347
METRIC RANK
97.6%
3RD GRADE
9.6/ 100
METRIC RATING
209th/ 347
METRIC RANK
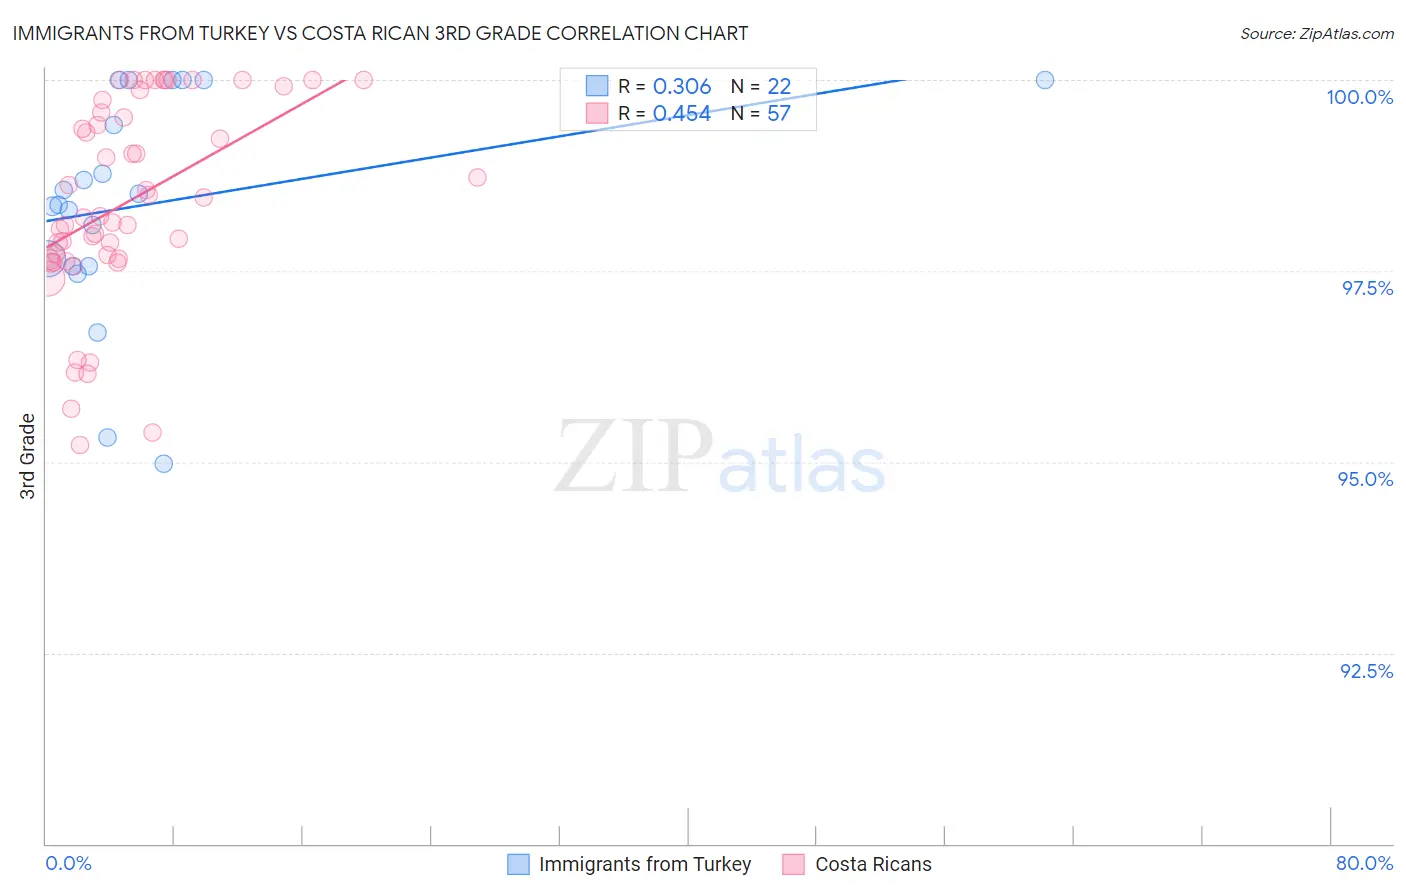
Immigrants from Turkey vs Costa Rican 3rd Grade Correlation Chart
The statistical analysis conducted on geographies consisting of 223,057,877 people shows a mild positive correlation between the proportion of Immigrants from Turkey and percentage of population with at least 3rd grade education in the United States with a correlation coefficient (R) of 0.306 and weighted average of 97.9%. Similarly, the statistical analysis conducted on geographies consisting of 253,599,979 people shows a moderate positive correlation between the proportion of Costa Ricans and percentage of population with at least 3rd grade education in the United States with a correlation coefficient (R) of 0.454 and weighted average of 97.6%, a difference of 0.33%.
3rd Grade Correlation Summary
| Measurement | Immigrants from Turkey | Costa Rican |
| Minimum | 95.0% | 95.2% |
| Maximum | 100.0% | 100.0% |
| Range | 5.0% | 4.8% |
| Mean | 98.4% | 98.4% |
| Median | 98.4% | 98.2% |
| Interquartile 25% (IQ1) | 97.6% | 97.7% |
| Interquartile 75% (IQ3) | 100.0% | 99.7% |
| Interquartile Range (IQR) | 2.4% | 2.0% |
| Standard Deviation (Sample) | 1.4% | 1.3% |
| Standard Deviation (Population) | 1.4% | 1.3% |
Similar Demographics by 3rd Grade
Demographics Similar to Immigrants from Turkey by 3rd Grade
In terms of 3rd grade, the demographic groups most similar to Immigrants from Turkey are Palestinian (97.9%, a difference of 0.010%), Israeli (97.9%, a difference of 0.020%), Blackfeet (97.9%, a difference of 0.020%), Hmong (97.9%, a difference of 0.020%), and Filipino (97.9%, a difference of 0.020%).
| Demographics | Rating | Rank | 3rd Grade |
| Seminole | 88.7 /100 | #134 | Excellent 97.9% |
| Cambodians | 88.1 /100 | #135 | Excellent 97.9% |
| Spaniards | 87.9 /100 | #136 | Excellent 97.9% |
| Immigrants | Romania | 87.9 /100 | #137 | Excellent 97.9% |
| Israelis | 86.6 /100 | #138 | Excellent 97.9% |
| Blackfeet | 86.3 /100 | #139 | Excellent 97.9% |
| Palestinians | 84.6 /100 | #140 | Excellent 97.9% |
| Immigrants | Turkey | 83.5 /100 | #141 | Excellent 97.9% |
| Hmong | 80.3 /100 | #142 | Excellent 97.9% |
| Filipinos | 79.9 /100 | #143 | Good 97.9% |
| Burmese | 79.6 /100 | #144 | Good 97.9% |
| Immigrants | Greece | 79.5 /100 | #145 | Good 97.9% |
| Alsatians | 78.3 /100 | #146 | Good 97.9% |
| Immigrants | Israel | 77.3 /100 | #147 | Good 97.9% |
| Immigrants | Moldova | 77.1 /100 | #148 | Good 97.9% |
Demographics Similar to Costa Ricans by 3rd Grade
In terms of 3rd grade, the demographic groups most similar to Costa Ricans are Immigrants from Oceania (97.6%, a difference of 0.0%), Laotian (97.6%, a difference of 0.0%), Immigrants from Bahamas (97.6%, a difference of 0.010%), Moroccan (97.6%, a difference of 0.010%), and Yuman (97.6%, a difference of 0.010%).
| Demographics | Rating | Rank | 3rd Grade |
| Immigrants | Southern Europe | 17.7 /100 | #202 | Poor 97.6% |
| Paiute | 16.7 /100 | #203 | Poor 97.6% |
| Immigrants | Chile | 16.5 /100 | #204 | Poor 97.6% |
| Africans | 14.5 /100 | #205 | Poor 97.6% |
| Immigrants | Northern Africa | 13.0 /100 | #206 | Poor 97.6% |
| Tohono O'odham | 12.5 /100 | #207 | Poor 97.6% |
| Immigrants | Zaire | 11.9 /100 | #208 | Poor 97.6% |
| Costa Ricans | 9.6 /100 | #209 | Tragic 97.6% |
| Immigrants | Oceania | 9.5 /100 | #210 | Tragic 97.6% |
| Laotians | 9.4 /100 | #211 | Tragic 97.6% |
| Immigrants | Bahamas | 8.5 /100 | #212 | Tragic 97.6% |
| Moroccans | 8.5 /100 | #213 | Tragic 97.6% |
| Yuman | 8.4 /100 | #214 | Tragic 97.6% |
| Iraqis | 6.9 /100 | #215 | Tragic 97.5% |
| Samoans | 6.9 /100 | #216 | Tragic 97.5% |