Immigrants from Turkey vs Black/African American College, 1 year or more

COMPARE

Immigrants from Turkey
Race
Ancestry
AfghanAfricanAlaska NativeAlaskan AthabascanAlbanianAleutAlsatianAmericanApacheArabArapahoArgentineanArmenianAssyrian/Chaldean/SyriacAustralianAustrianBahamianBangladeshiBarbadianBasqueBelgianBelizeanBermudanBhutaneseBlackfeetBolivianBrazilianBritishBritish West IndianBulgarianBurmeseCajunCambodianCanadianCape VerdeanCarpatho RusynCelticCentral AmericanCentral American IndianCherokeeCheyenneChickasawChileanChineseChippewaChoctawColombianColvilleComancheCosta RicanCreeCreekCroatianCrowCubanCypriotCzechCzechoslovakianDanishDelawareDominicanDutchDutch West IndianEastern EuropeanEcuadorianEgyptianEnglishEstonianEthiopianEuropeanFijianFilipinoFinnishFrenchFrench American IndianFrench CanadianGermanGerman RussianGhanaianGreekGuamanian/ChamorroGuatemalanGuyaneseHaitianHmongHonduranHopiHoumaHungarianIcelanderIndian (Asian)IndonesianInupiatIranianIraqiIrishIroquoisIsraeliItalianJamaicanJapaneseJordanianKenyanKiowaKoreanLaotianLatvianLebaneseLiberianLithuanianLumbeeLuxembourgerMacedonianMalaysianMalteseMarshalleseMenomineeMexicanMexican American IndianMongolianMoroccanNative HawaiianNavajoNepaleseNew ZealanderNicaraguanNigerianNorthern EuropeanNorwegianOkinawanOsageOttawaPaiutePakistaniPalestinianPanamanianParaguayanPennsylvania GermanPeruvianPimaPolishPortuguesePotawatomiPuebloPuerto RicanPuget Sound SalishRomanianRussianSalvadoranSamoanScandinavianScotch-IrishScottishSeminoleSenegaleseSerbianShoshoneSierra LeoneanSiouxSlavicSlovakSloveneSomaliSouth AfricanSouth AmericanSouth American IndianSoviet UnionSpaniardSpanishSpanish AmericanSpanish American IndianSri LankanSubsaharan AfricanSudaneseSwedishSwissSyrianTaiwaneseThaiTlingit-HaidaTohono O'OdhamTonganTrinidadian and TobagonianTsimshianTurkishU.S. Virgin IslanderUgandanUkrainianUruguayanUteVenezuelanVietnameseWelshWest IndianYakamaYaquiYugoslavianYumanYup'ikZimbabwean
Immigration
NonimmigrantsImmigrantsAfghanistanAfricaAlbaniaArgentinaArmeniaAsiaAustraliaAustriaBahamasBangladeshBarbadosBelarusBelgiumBelizeBoliviaBosnia and HerzegovinaBrazilBulgariaBurma/MyanmarCabo VerdeCambodiaCameroonCanadaCaribbeanCentral AmericaChileChinaColombiaCongoCosta RicaCroatiaCubaCzechoslovakiaDenmarkDominicaDominican RepublicEastern AfricaEastern AsiaEastern EuropeEcuadorEgyptEl SalvadorEnglandEritreaEthiopiaEuropeFijiFranceGermanyGhanaGreeceGrenadaGuatemalaGuyanaHaitiHondurasHong KongHungaryIndiaIndonesiaIranIraqIrelandIsraelItalyJamaicaJapanJordanKazakhstanKenyaKoreaKuwaitLaosLatin AmericaLatviaLebanonLiberiaLithuaniaMalaysiaMexicoMicronesiaMiddle AfricaMoldovaMoroccoNepalNetherlandsNicaraguaNigeriaNorth AmericaNorth MacedoniaNorthern AfricaNorthern EuropeNorwayOceaniaPakistanPanamaPeruPhilippinesPolandPortugalRomaniaRussiaSaudi ArabiaScotlandSenegalSerbiaSierra LeoneSingaporeSomaliaSouth AfricaSouth AmericaSouth Central AsiaSouth Eastern AsiaSouthern EuropeSpainSri LankaSt. Vincent and the GrenadinesSudanSwedenSwitzerlandSyriaTaiwanThailandTrinidad and TobagoTurkeyUgandaUkraineUruguayUzbekistanVenezuelaVietnamWest IndiesWestern AfricaWestern AsiaWestern EuropeYemenZaireZimbabweAzores
Black/African American
Race
Ancestry
AfghanAfricanAlaska NativeAlaskan AthabascanAlbanianAleutAlsatianAmericanApacheArabArapahoArgentineanArmenianAssyrian/Chaldean/SyriacAustralianAustrianBahamianBangladeshiBarbadianBasqueBelgianBelizeanBermudanBhutaneseBlackfeetBolivianBrazilianBritishBritish West IndianBulgarianBurmeseCajunCambodianCanadianCape VerdeanCarpatho RusynCelticCentral AmericanCentral American IndianCherokeeCheyenneChickasawChileanChineseChippewaChoctawColombianColvilleComancheCosta RicanCreeCreekCroatianCrowCubanCypriotCzechCzechoslovakianDanishDelawareDominicanDutchDutch West IndianEastern EuropeanEcuadorianEgyptianEnglishEstonianEthiopianEuropeanFijianFilipinoFinnishFrenchFrench American IndianFrench CanadianGermanGerman RussianGhanaianGreekGuamanian/ChamorroGuatemalanGuyaneseHaitianHmongHonduranHopiHoumaHungarianIcelanderIndian (Asian)IndonesianInupiatIranianIraqiIrishIroquoisIsraeliItalianJamaicanJapaneseJordanianKenyanKiowaKoreanLaotianLatvianLebaneseLiberianLithuanianLumbeeLuxembourgerMacedonianMalaysianMalteseMarshalleseMenomineeMexicanMexican American IndianMongolianMoroccanNative HawaiianNavajoNepaleseNew ZealanderNicaraguanNigerianNorthern EuropeanNorwegianOkinawanOsageOttawaPaiutePakistaniPalestinianPanamanianParaguayanPennsylvania GermanPeruvianPimaPolishPortuguesePotawatomiPuebloPuerto RicanPuget Sound SalishRomanianRussianSalvadoranSamoanScandinavianScotch-IrishScottishSeminoleSenegaleseSerbianShoshoneSierra LeoneanSiouxSlavicSlovakSloveneSomaliSouth AfricanSouth AmericanSouth American IndianSoviet UnionSpaniardSpanishSpanish AmericanSpanish American IndianSri LankanSubsaharan AfricanSudaneseSwedishSwissSyrianTaiwaneseThaiTlingit-HaidaTohono O'OdhamTonganTrinidadian and TobagonianTsimshianTurkishU.S. Virgin IslanderUgandanUkrainianUruguayanUteVenezuelanVietnameseWelshWest IndianYakamaYaquiYugoslavianYumanYup'ikZimbabwean
Immigration
NonimmigrantsImmigrantsAfghanistanAfricaAlbaniaArgentinaArmeniaAsiaAustraliaAustriaBahamasBangladeshBarbadosBelarusBelgiumBelizeBoliviaBosnia and HerzegovinaBrazilBulgariaBurma/MyanmarCabo VerdeCambodiaCameroonCanadaCaribbeanCentral AmericaChileChinaColombiaCongoCosta RicaCroatiaCubaCzechoslovakiaDenmarkDominicaDominican RepublicEastern AfricaEastern AsiaEastern EuropeEcuadorEgyptEl SalvadorEnglandEritreaEthiopiaEuropeFijiFranceGermanyGhanaGreeceGrenadaGuatemalaGuyanaHaitiHondurasHong KongHungaryIndiaIndonesiaIranIraqIrelandIsraelItalyJamaicaJapanJordanKazakhstanKenyaKoreaKuwaitLaosLatin AmericaLatviaLebanonLiberiaLithuaniaMalaysiaMexicoMicronesiaMiddle AfricaMoldovaMoroccoNepalNetherlandsNicaraguaNigeriaNorth AmericaNorth MacedoniaNorthern AfricaNorthern EuropeNorwayOceaniaPakistanPanamaPeruPhilippinesPolandPortugalRomaniaRussiaSaudi ArabiaScotlandSenegalSerbiaSierra LeoneSingaporeSomaliaSouth AfricaSouth AmericaSouth Central AsiaSouth Eastern AsiaSouthern EuropeSpainSri LankaSt. Vincent and the GrenadinesSudanSwedenSwitzerlandSyriaTaiwanThailandTrinidad and TobagoUgandaUkraineUruguayUzbekistanVenezuelaVietnamWest IndiesWestern AfricaWestern AsiaWestern EuropeYemenZaireZimbabweAzores
College, 1 year or more
Income
Poverty
Unemployment
Labor Participation
Family Structure
Vehicle Availability
Education Level
Disability

College, 1 year or more Comparison

Immigrants from Turkey

Blacks/African Americans

Exceptional
Tragic
65.2%
COLLEGE, 1 YEAR OR MORE
99.9/ 100
METRIC RATING
35th/ 347
METRIC RANK
53.3%
COLLEGE, 1 YEAR OR MORE
0.0/ 100
METRIC RATING
293rd/ 347
METRIC RANK

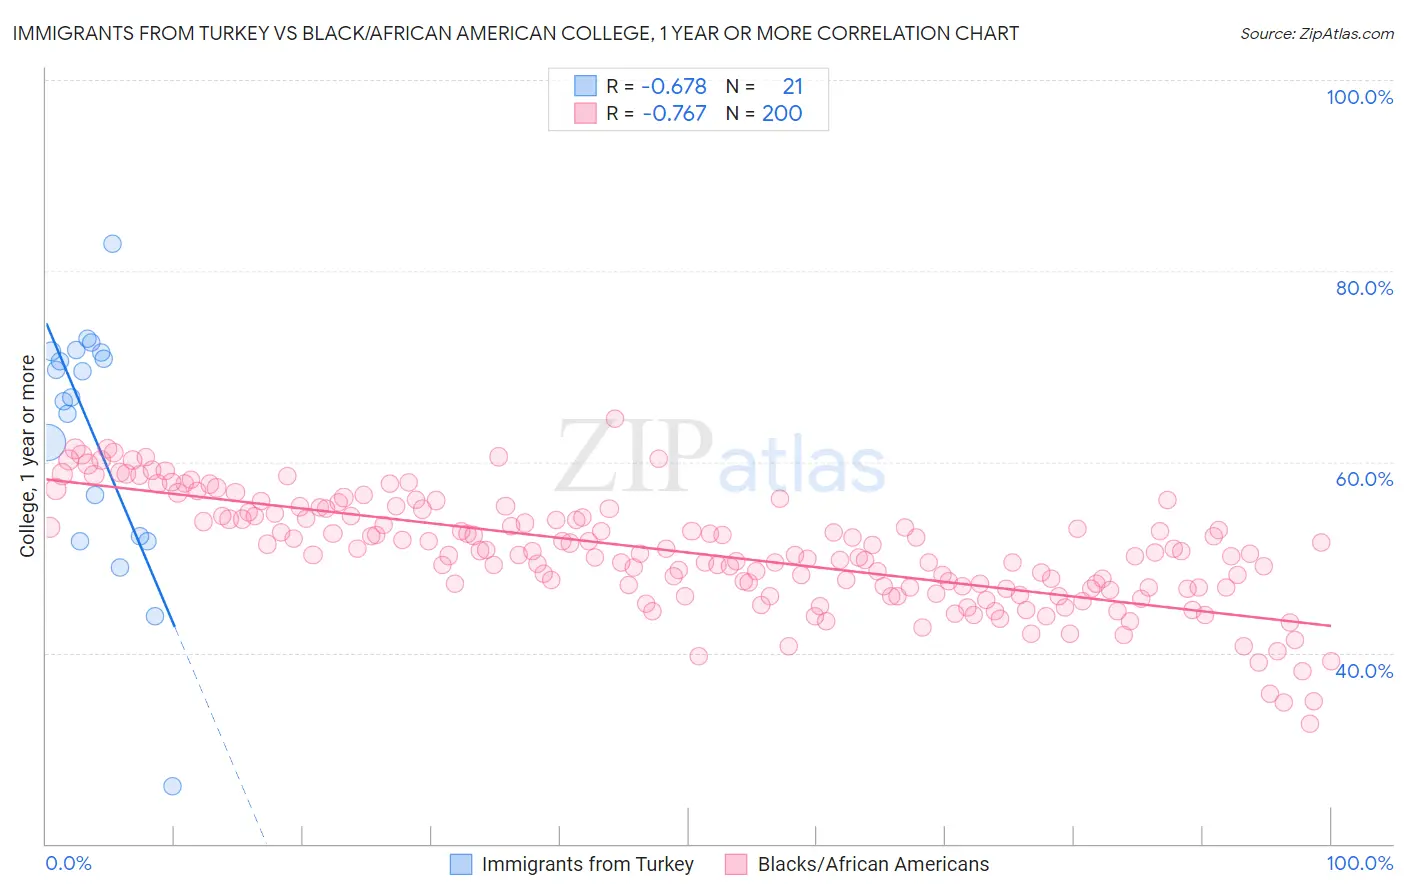
Immigrants from Turkey vs Black/African American College, 1 year or more Correlation Chart

The statistical analysis conducted on geographies consisting of 223,057,840 people shows a significant negative correlation between the proportion of Immigrants from Turkey and percentage of population with at least college, 1 year or more education in the United States with a correlation coefficient (R) of -0.678 and weighted average of 65.2%. Similarly, the statistical analysis conducted on geographies consisting of 566,034,160 people shows a strong negative correlation between the proportion of Blacks/African Americans and percentage of population with at least college, 1 year or more education in the United States with a correlation coefficient (R) of -0.767 and weighted average of 53.3%, a difference of 22.3%.
Immigrants from Turkey vs Black/African American College, 1 year or more

College, 1 year or more Correlation Summary

MeasurementImmigrants from TurkeyBlack/African American
Minimum26.0%32.6%
Maximum82.8%64.6%
Range56.8%32.0%
Mean62.6%50.5%
Median66.8%50.3%
Interquartile 25% (IQ1)52.0%46.8%
Interquartile 75% (IQ3)71.5%54.3%
Interquartile Range (IQR)19.5%7.5%
Standard Deviation (Sample)13.0%5.8%
Standard Deviation (Population)12.7%5.8%

Similar Demographics by College, 1 year or more

Demographics Similar to Immigrants from Turkey by College, 1 year or more

In terms of college, 1 year or more, the demographic groups most similar to Immigrants from Turkey are Immigrants from South Africa (65.1%, a difference of 0.080%), Russian (65.1%, a difference of 0.090%), Israeli (65.3%, a difference of 0.20%), Immigrants from Saudi Arabia (65.0%, a difference of 0.24%), and Estonian (65.0%, a difference of 0.31%).
DemographicsRating | RankCollege, 1 year or more
Immigrants | France
100.0
/100
|
#28
Exceptional
65.8%
Immigrants | Northern Europe
100.0
/100
|
#29
Exceptional
65.6%
Immigrants | Denmark
100.0
/100
|
#30
Exceptional
65.6%
Turks
100.0
/100
|
#31
Exceptional
65.5%
Bulgarians
100.0
/100
|
#32
Exceptional
65.5%
Immigrants | Sri Lanka
99.9
/100
|
#33
Exceptional
65.4%
Israelis
99.9
/100
|
#34
Exceptional
65.3%
Immigrants | Turkey
99.9
/100
|
#35
Exceptional
65.2%
Immigrants | South Africa
99.9
/100
|
#36
Exceptional
65.1%
Russians
99.9
/100
|
#37
Exceptional
65.1%
Immigrants | Saudi Arabia
99.9
/100
|
#38
Exceptional
65.0%
Estonians
99.9
/100
|
#39
Exceptional
65.0%
Immigrants | Kuwait
99.9
/100
|
#40
Exceptional
65.0%
Mongolians
99.9
/100
|
#41
Exceptional
64.8%
Immigrants | Latvia
99.9
/100
|
#42
Exceptional
64.8%

Demographics Similar to Blacks/African Americans by College, 1 year or more

In terms of college, 1 year or more, the demographic groups most similar to Blacks/African Americans are Chickasaw (53.3%, a difference of 0.020%), Cuban (53.4%, a difference of 0.15%), Alaskan Athabascan (53.4%, a difference of 0.20%), Cherokee (53.2%, a difference of 0.21%), and Alaska Native (53.4%, a difference of 0.22%).
DemographicsRating | RankCollege, 1 year or more
Central American Indians
0.1
/100
|
#286
Tragic
53.5%
Immigrants | Belize
0.1
/100
|
#287
Tragic
53.5%
Alaska Natives
0.0
/100
|
#288
Tragic
53.4%
Immigrants | Ecuador
0.0
/100
|
#289
Tragic
53.4%
Alaskan Athabascans
0.0
/100
|
#290
Tragic
53.4%
Cubans
0.0
/100
|
#291
Tragic
53.4%
Chickasaw
0.0
/100
|
#292
Tragic
53.3%
Blacks/African Americans
0.0
/100
|
#293
Tragic
53.3%
Cherokee
0.0
/100
|
#294
Tragic
53.2%
Yaqui
0.0
/100
|
#295
Tragic
53.2%
Sioux
0.0
/100
|
#296
Tragic
53.0%
Paiute
0.0
/100
|
#297
Tragic
52.9%
Immigrants | Dominica
0.0
/100
|
#298
Tragic
52.5%
Immigrants | Nicaragua
0.0
/100
|
#299
Tragic
52.4%
Choctaw
0.0
/100
|
#300
Tragic
52.3%