Immigrants from Trinidad and Tobago vs Sioux Doctorate Degree
COMPARE
Immigrants from Trinidad and Tobago
Sioux
Doctorate Degree
Doctorate Degree Comparison
Immigrants from Trinidad and Tobago
Sioux
1.5%
DOCTORATE DEGREE
0.5/ 100
METRIC RATING
271st/ 347
METRIC RANK
1.5%
DOCTORATE DEGREE
0.4/ 100
METRIC RATING
273rd/ 347
METRIC RANK
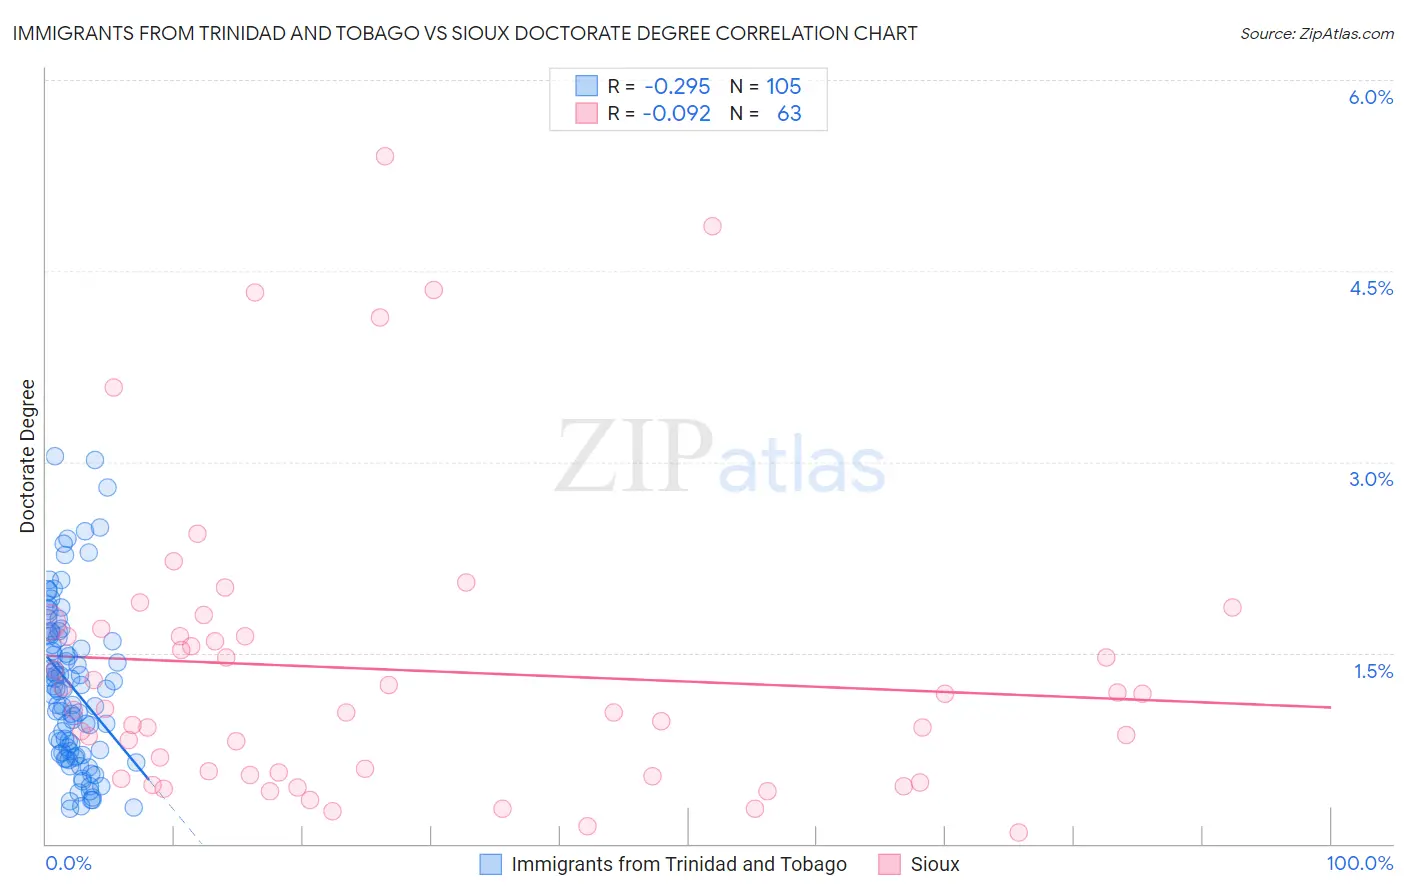
Immigrants from Trinidad and Tobago vs Sioux Doctorate Degree Correlation Chart
The statistical analysis conducted on geographies consisting of 222,674,417 people shows a weak negative correlation between the proportion of Immigrants from Trinidad and Tobago and percentage of population with at least doctorate degree education in the United States with a correlation coefficient (R) of -0.295 and weighted average of 1.5%. Similarly, the statistical analysis conducted on geographies consisting of 231,042,673 people shows a slight negative correlation between the proportion of Sioux and percentage of population with at least doctorate degree education in the United States with a correlation coefficient (R) of -0.092 and weighted average of 1.5%, a difference of 0.20%.
Doctorate Degree Correlation Summary
| Measurement | Immigrants from Trinidad and Tobago | Sioux |
| Minimum | 0.28% | 0.086% |
| Maximum | 3.0% | 5.4% |
| Range | 2.8% | 5.3% |
| Mean | 1.2% | 1.4% |
| Median | 1.2% | 1.1% |
| Interquartile 25% (IQ1) | 0.71% | 0.54% |
| Interquartile 75% (IQ3) | 1.6% | 1.6% |
| Interquartile Range (IQR) | 0.93% | 1.1% |
| Standard Deviation (Sample) | 0.63% | 1.2% |
| Standard Deviation (Population) | 0.63% | 1.2% |
Demographics Similar to Immigrants from Trinidad and Tobago and Sioux by Doctorate Degree
In terms of doctorate degree, the demographic groups most similar to Immigrants from Trinidad and Tobago are Salvadoran (1.5%, a difference of 0.070%), Immigrants from Barbados (1.5%, a difference of 0.090%), Crow (1.5%, a difference of 0.10%), Kiowa (1.5%, a difference of 0.19%), and U.S. Virgin Islander (1.5%, a difference of 0.19%). Similarly, the demographic groups most similar to Sioux are Yaqui (1.5%, a difference of 0.020%), Immigrants from Barbados (1.5%, a difference of 0.11%), Aleut (1.5%, a difference of 0.14%), Paiute (1.5%, a difference of 0.19%), and Salvadoran (1.5%, a difference of 0.27%).
| Demographics | Rating | Rank | Doctorate Degree |
| Chickasaw | 0.7 /100 | #262 | Tragic 1.5% |
| Immigrants | Bahamas | 0.7 /100 | #263 | Tragic 1.5% |
| Blackfeet | 0.7 /100 | #264 | Tragic 1.5% |
| Nicaraguans | 0.6 /100 | #265 | Tragic 1.5% |
| Immigrants | Liberia | 0.5 /100 | #266 | Tragic 1.5% |
| Kiowa | 0.5 /100 | #267 | Tragic 1.5% |
| U.S. Virgin Islanders | 0.5 /100 | #268 | Tragic 1.5% |
| Crow | 0.5 /100 | #269 | Tragic 1.5% |
| Salvadorans | 0.5 /100 | #270 | Tragic 1.5% |
| Immigrants | Trinidad and Tobago | 0.5 /100 | #271 | Tragic 1.5% |
| Immigrants | Barbados | 0.4 /100 | #272 | Tragic 1.5% |
| Sioux | 0.4 /100 | #273 | Tragic 1.5% |
| Yaqui | 0.4 /100 | #274 | Tragic 1.5% |
| Aleuts | 0.4 /100 | #275 | Tragic 1.5% |
| Paiute | 0.4 /100 | #276 | Tragic 1.5% |
| Bahamians | 0.4 /100 | #277 | Tragic 1.5% |
| Hawaiians | 0.4 /100 | #278 | Tragic 1.5% |
| Marshallese | 0.4 /100 | #279 | Tragic 1.5% |
| Ecuadorians | 0.4 /100 | #280 | Tragic 1.5% |
| Tohono O'odham | 0.4 /100 | #281 | Tragic 1.5% |
| British West Indians | 0.3 /100 | #282 | Tragic 1.5% |