Immigrants from Trinidad and Tobago vs Immigrants from Kenya 4th Grade

COMPARE

Immigrants from Trinidad and Tobago
Race
Ancestry
AfghanAfricanAlaska NativeAlaskan AthabascanAlbanianAleutAlsatianAmericanApacheArabArapahoArgentineanArmenianAssyrian/Chaldean/SyriacAustralianAustrianBahamianBangladeshiBarbadianBasqueBelgianBelizeanBermudanBhutaneseBlackfeetBolivianBrazilianBritishBritish West IndianBulgarianBurmeseCajunCambodianCanadianCape VerdeanCarpatho RusynCelticCentral AmericanCentral American IndianCherokeeCheyenneChickasawChileanChineseChippewaChoctawColombianColvilleComancheCosta RicanCreeCreekCroatianCrowCubanCypriotCzechCzechoslovakianDanishDelawareDominicanDutchDutch West IndianEastern EuropeanEcuadorianEgyptianEnglishEstonianEthiopianEuropeanFijianFilipinoFinnishFrenchFrench American IndianFrench CanadianGermanGerman RussianGhanaianGreekGuamanian/ChamorroGuatemalanGuyaneseHaitianHmongHonduranHopiHoumaHungarianIcelanderIndian (Asian)IndonesianInupiatIranianIraqiIrishIroquoisIsraeliItalianJamaicanJapaneseJordanianKenyanKiowaKoreanLaotianLatvianLebaneseLiberianLithuanianLumbeeLuxembourgerMacedonianMalaysianMalteseMarshalleseMenomineeMexicanMexican American IndianMongolianMoroccanNative HawaiianNavajoNepaleseNew ZealanderNicaraguanNigerianNorthern EuropeanNorwegianOkinawanOsageOttawaPaiutePakistaniPalestinianPanamanianParaguayanPennsylvania GermanPeruvianPimaPolishPortuguesePotawatomiPuebloPuerto RicanPuget Sound SalishRomanianRussianSalvadoranSamoanScandinavianScotch-IrishScottishSeminoleSenegaleseSerbianShoshoneSierra LeoneanSiouxSlavicSlovakSloveneSomaliSouth AfricanSouth AmericanSouth American IndianSoviet UnionSpaniardSpanishSpanish AmericanSpanish American IndianSri LankanSubsaharan AfricanSudaneseSwedishSwissSyrianTaiwaneseThaiTlingit-HaidaTohono O'OdhamTonganTrinidadian and TobagonianTsimshianTurkishU.S. Virgin IslanderUgandanUkrainianUruguayanUteVenezuelanVietnameseWelshWest IndianYakamaYaquiYugoslavianYumanYup'ikZimbabwean
Immigration
NonimmigrantsImmigrantsAfghanistanAfricaAlbaniaArgentinaArmeniaAsiaAustraliaAustriaBahamasBangladeshBarbadosBelarusBelgiumBelizeBoliviaBosnia and HerzegovinaBrazilBulgariaBurma/MyanmarCabo VerdeCambodiaCameroonCanadaCaribbeanCentral AmericaChileChinaColombiaCongoCosta RicaCroatiaCubaCzechoslovakiaDenmarkDominicaDominican RepublicEastern AfricaEastern AsiaEastern EuropeEcuadorEgyptEl SalvadorEnglandEritreaEthiopiaEuropeFijiFranceGermanyGhanaGreeceGrenadaGuatemalaGuyanaHaitiHondurasHong KongHungaryIndiaIndonesiaIranIraqIrelandIsraelItalyJamaicaJapanJordanKazakhstanKoreaKuwaitLaosLatin AmericaLatviaLebanonLiberiaLithuaniaMalaysiaMexicoMicronesiaMiddle AfricaMoldovaMoroccoNepalNetherlandsNicaraguaNigeriaNorth AmericaNorth MacedoniaNorthern AfricaNorthern EuropeNorwayOceaniaPakistanPanamaPeruPhilippinesPolandPortugalRomaniaRussiaSaudi ArabiaScotlandSenegalSerbiaSierra LeoneSingaporeSomaliaSouth AfricaSouth AmericaSouth Central AsiaSouth Eastern AsiaSouthern EuropeSpainSri LankaSt. Vincent and the GrenadinesSudanSwedenSwitzerlandSyriaTaiwanThailandTrinidad and TobagoTurkeyUgandaUkraineUruguayUzbekistanVenezuelaVietnamWest IndiesWestern AfricaWestern AsiaWestern EuropeYemenZaireZimbabweAzores
Immigrants from Kenya
Race
Ancestry
AfghanAfricanAlaska NativeAlaskan AthabascanAlbanianAleutAlsatianAmericanApacheArabArapahoArgentineanArmenianAssyrian/Chaldean/SyriacAustralianAustrianBahamianBangladeshiBarbadianBasqueBelgianBelizeanBermudanBhutaneseBlackfeetBolivianBrazilianBritishBritish West IndianBulgarianBurmeseCajunCambodianCanadianCape VerdeanCarpatho RusynCelticCentral AmericanCentral American IndianCherokeeCheyenneChickasawChileanChineseChippewaChoctawColombianColvilleComancheCosta RicanCreeCreekCroatianCrowCubanCypriotCzechCzechoslovakianDanishDelawareDominicanDutchDutch West IndianEastern EuropeanEcuadorianEgyptianEnglishEstonianEthiopianEuropeanFijianFilipinoFinnishFrenchFrench American IndianFrench CanadianGermanGerman RussianGhanaianGreekGuamanian/ChamorroGuatemalanGuyaneseHaitianHmongHonduranHopiHoumaHungarianIcelanderIndian (Asian)IndonesianInupiatIranianIraqiIrishIroquoisIsraeliItalianJamaicanJapaneseJordanianKenyanKiowaKoreanLaotianLatvianLebaneseLiberianLithuanianLumbeeLuxembourgerMacedonianMalaysianMalteseMarshalleseMenomineeMexicanMexican American IndianMongolianMoroccanNative HawaiianNavajoNepaleseNew ZealanderNicaraguanNigerianNorthern EuropeanNorwegianOkinawanOsageOttawaPaiutePakistaniPalestinianPanamanianParaguayanPennsylvania GermanPeruvianPimaPolishPortuguesePotawatomiPuebloPuerto RicanPuget Sound SalishRomanianRussianSalvadoranSamoanScandinavianScotch-IrishScottishSeminoleSenegaleseSerbianShoshoneSierra LeoneanSiouxSlavicSlovakSloveneSomaliSouth AfricanSouth AmericanSouth American IndianSoviet UnionSpaniardSpanishSpanish AmericanSpanish American IndianSri LankanSubsaharan AfricanSudaneseSwedishSwissSyrianTaiwaneseThaiTlingit-HaidaTohono O'OdhamTonganTrinidadian and TobagonianTsimshianTurkishU.S. Virgin IslanderUgandanUkrainianUruguayanUteVenezuelanVietnameseWelshWest IndianYakamaYaquiYugoslavianYumanYup'ikZimbabwean
Immigration
NonimmigrantsImmigrantsAfghanistanAfricaAlbaniaArgentinaArmeniaAsiaAustraliaAustriaBahamasBangladeshBarbadosBelarusBelgiumBelizeBoliviaBosnia and HerzegovinaBrazilBulgariaBurma/MyanmarCabo VerdeCambodiaCameroonCanadaCaribbeanCentral AmericaChileChinaColombiaCongoCosta RicaCroatiaCubaCzechoslovakiaDenmarkDominicaDominican RepublicEastern AfricaEastern AsiaEastern EuropeEcuadorEgyptEl SalvadorEnglandEritreaEthiopiaEuropeFijiFranceGermanyGhanaGreeceGrenadaGuatemalaGuyanaHaitiHondurasHong KongHungaryIndiaIndonesiaIranIraqIrelandIsraelItalyJamaicaJapanJordanKazakhstanKenyaKoreaKuwaitLaosLatin AmericaLatviaLebanonLiberiaLithuaniaMalaysiaMexicoMicronesiaMiddle AfricaMoldovaMoroccoNepalNetherlandsNicaraguaNigeriaNorth AmericaNorth MacedoniaNorthern AfricaNorthern EuropeNorwayOceaniaPakistanPanamaPeruPhilippinesPolandPortugalRomaniaRussiaSaudi ArabiaScotlandSenegalSerbiaSierra LeoneSingaporeSomaliaSouth AfricaSouth AmericaSouth Central AsiaSouth Eastern AsiaSouthern EuropeSpainSri LankaSt. Vincent and the GrenadinesSudanSwedenSwitzerlandSyriaTaiwanThailandTurkeyUgandaUkraineUruguayUzbekistanVenezuelaVietnamWest IndiesWestern AfricaWestern AsiaWestern EuropeYemenZaireZimbabweAzores
4th Grade
Income
Poverty
Unemployment
Labor Participation
Family Structure
Vehicle Availability
Education Level
Disability

4th Grade Comparison

Immigrants from Trinidad and Tobago

Immigrants from Kenya

Tragic
Fair
96.8%
4TH GRADE
0.1/ 100
METRIC RATING
282nd/ 347
METRIC RANK
97.5%
4TH GRADE
35.8/ 100
METRIC RATING
185th/ 347
METRIC RANK

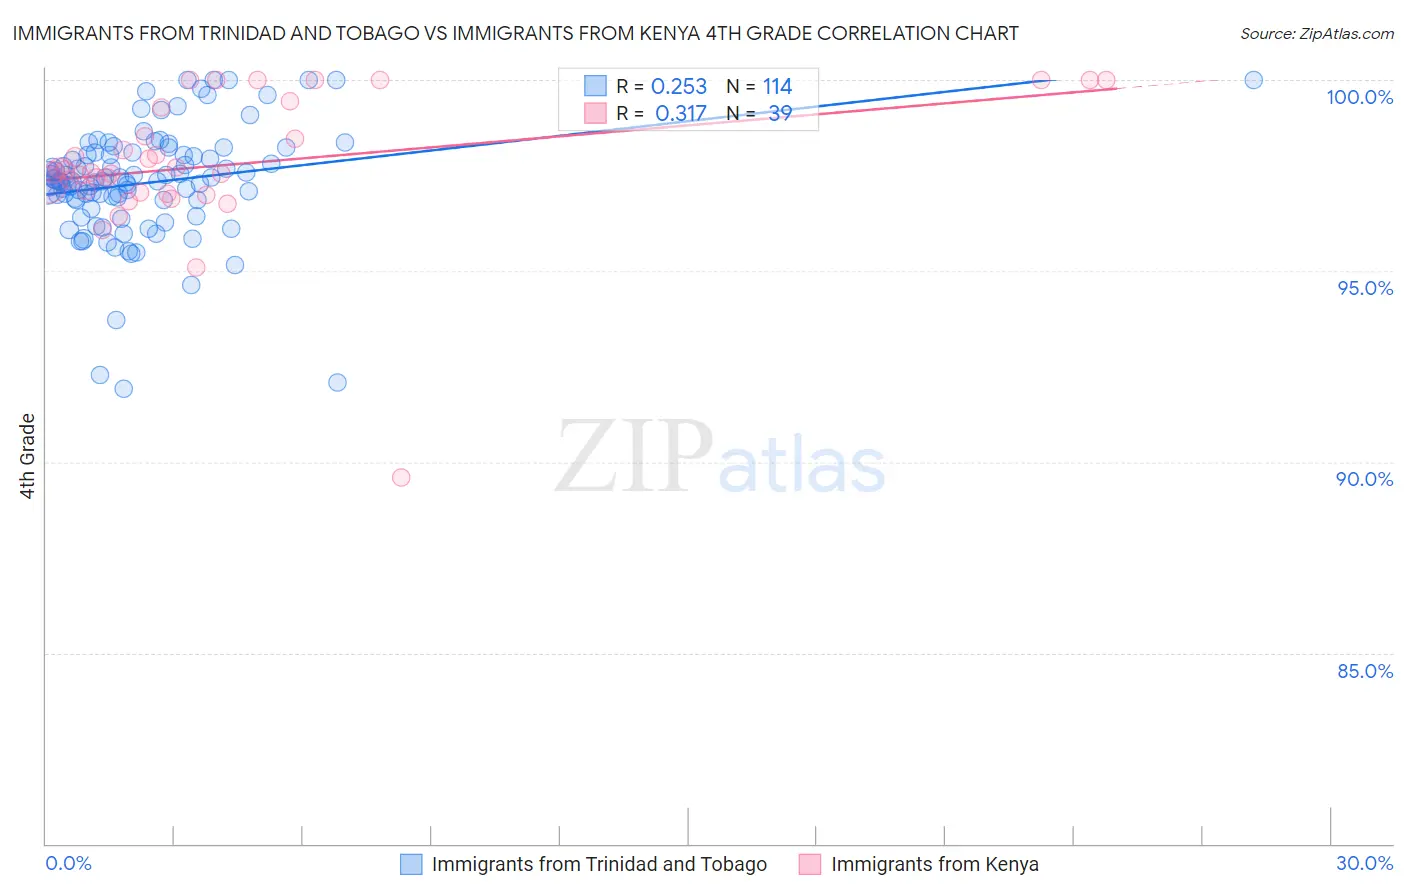
Immigrants from Trinidad and Tobago vs Immigrants from Kenya 4th Grade Correlation Chart

The statistical analysis conducted on geographies consisting of 223,526,834 people shows a weak positive correlation between the proportion of Immigrants from Trinidad and Tobago and percentage of population with at least 4th grade education in the United States with a correlation coefficient (R) of 0.253 and weighted average of 96.8%. Similarly, the statistical analysis conducted on geographies consisting of 218,076,690 people shows a mild positive correlation between the proportion of Immigrants from Kenya and percentage of population with at least 4th grade education in the United States with a correlation coefficient (R) of 0.317 and weighted average of 97.5%, a difference of 0.64%.
Immigrants from Trinidad and Tobago vs Immigrants from Kenya 4th Grade

4th Grade Correlation Summary

MeasurementImmigrants from Trinidad and TobagoImmigrants from Kenya
Minimum91.9%89.6%
Maximum100.0%100.0%
Range8.1%10.4%
Mean97.3%97.8%
Median97.3%97.6%
Interquartile 25% (IQ1)96.9%97.1%
Interquartile 75% (IQ3)98.1%99.3%
Interquartile Range (IQR)1.2%2.2%
Standard Deviation (Sample)1.5%1.9%
Standard Deviation (Population)1.5%1.8%

Similar Demographics by 4th Grade

Demographics Similar to Immigrants from Trinidad and Tobago by 4th Grade

In terms of 4th grade, the demographic groups most similar to Immigrants from Trinidad and Tobago are Immigrants from Hong Kong (96.9%, a difference of 0.0%), Immigrants from Philippines (96.8%, a difference of 0.0%), Barbadian (96.9%, a difference of 0.020%), Immigrants from St. Vincent and the Grenadines (96.8%, a difference of 0.020%), and Immigrants from Western Africa (96.9%, a difference of 0.030%).
DemographicsRating | Rank4th Grade
Immigrants | Ghana
0.1
/100
|
#275
Tragic
96.9%
Yaqui
0.1
/100
|
#276
Tragic
96.9%
Immigrants | Western Africa
0.1
/100
|
#277
Tragic
96.9%
Immigrants | Bolivia
0.1
/100
|
#278
Tragic
96.9%
Afghans
0.1
/100
|
#279
Tragic
96.9%
Barbadians
0.1
/100
|
#280
Tragic
96.9%
Immigrants | Hong Kong
0.1
/100
|
#281
Tragic
96.9%
Immigrants | Trinidad and Tobago
0.1
/100
|
#282
Tragic
96.8%
Immigrants | Philippines
0.1
/100
|
#283
Tragic
96.8%
Immigrants | St. Vincent and the Grenadines
0.1
/100
|
#284
Tragic
96.8%
Immigrants | Barbados
0.0
/100
|
#285
Tragic
96.8%
Immigrants | Thailand
0.0
/100
|
#286
Tragic
96.8%
Houma
0.0
/100
|
#287
Tragic
96.8%
Immigrants | Afghanistan
0.0
/100
|
#288
Tragic
96.8%
Immigrants | West Indies
0.0
/100
|
#289
Tragic
96.7%

Demographics Similar to Immigrants from Kenya by 4th Grade

In terms of 4th grade, the demographic groups most similar to Immigrants from Kenya are Pakistani (97.5%, a difference of 0.0%), Dutch West Indian (97.5%, a difference of 0.0%), Mongolian (97.5%, a difference of 0.0%), Immigrants from Argentina (97.5%, a difference of 0.0%), and Spanish American (97.5%, a difference of 0.010%).
DemographicsRating | Rank4th Grade
Comanche
45.3
/100
|
#178
Average
97.5%
Immigrants | Kazakhstan
43.6
/100
|
#179
Average
97.5%
Immigrants | Venezuela
42.7
/100
|
#180
Average
97.5%
Immigrants | Taiwan
41.5
/100
|
#181
Average
97.5%
Spanish Americans
39.3
/100
|
#182
Fair
97.5%
Argentineans
39.0
/100
|
#183
Fair
97.5%
Pakistanis
36.2
/100
|
#184
Fair
97.5%
Immigrants | Kenya
35.8
/100
|
#185
Fair
97.5%
Dutch West Indians
35.8
/100
|
#186
Fair
97.5%
Mongolians
34.7
/100
|
#187
Fair
97.5%
Immigrants | Argentina
34.6
/100
|
#188
Fair
97.5%
Panamanians
31.9
/100
|
#189
Fair
97.4%
Blacks/African Americans
31.1
/100
|
#190
Fair
97.4%
Navajo
30.7
/100
|
#191
Fair
97.4%
Immigrants | Ukraine
30.1
/100
|
#192
Fair
97.4%