Immigrants from Thailand vs Yaqui Kindergarten
COMPARE
Immigrants from Thailand
Yaqui
Kindergarten
Kindergarten Comparison
Immigrants from Thailand
Yaqui
97.3%
KINDERGARTEN
0.0/ 100
METRIC RATING
288th/ 347
METRIC RANK
97.6%
KINDERGARTEN
0.7/ 100
METRIC RATING
256th/ 347
METRIC RANK
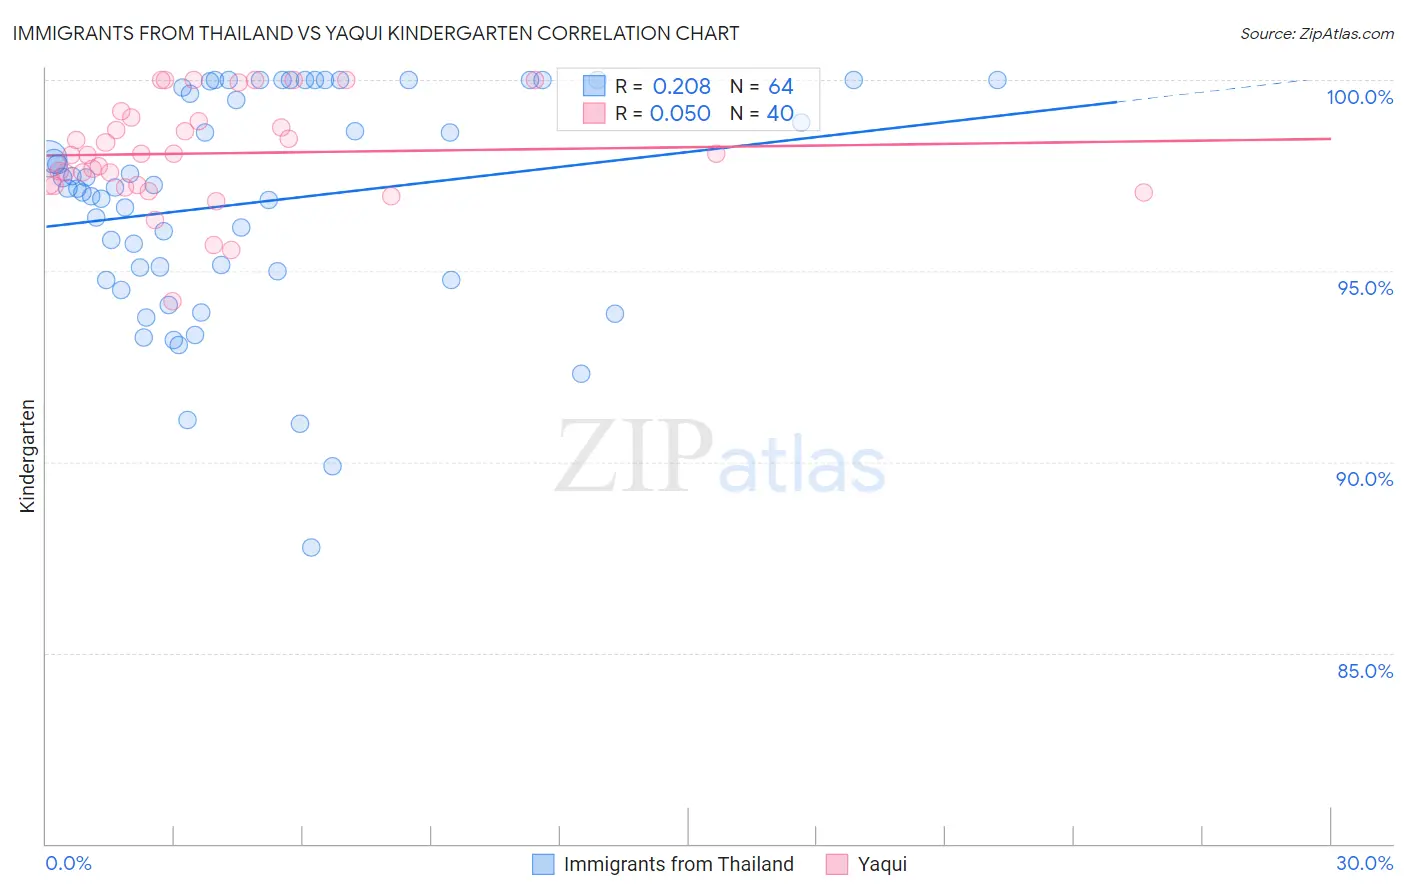
Immigrants from Thailand vs Yaqui Kindergarten Correlation Chart
The statistical analysis conducted on geographies consisting of 317,003,357 people shows a weak positive correlation between the proportion of Immigrants from Thailand and percentage of population with at least kindergarten education in the United States with a correlation coefficient (R) of 0.208 and weighted average of 97.3%. Similarly, the statistical analysis conducted on geographies consisting of 107,732,380 people shows no correlation between the proportion of Yaqui and percentage of population with at least kindergarten education in the United States with a correlation coefficient (R) of 0.050 and weighted average of 97.6%, a difference of 0.28%.
Kindergarten Correlation Summary
| Measurement | Immigrants from Thailand | Yaqui |
| Minimum | 87.7% | 94.2% |
| Maximum | 100.0% | 100.0% |
| Range | 12.3% | 5.8% |
| Mean | 96.8% | 98.1% |
| Median | 97.2% | 98.0% |
| Interquartile 25% (IQ1) | 94.9% | 97.2% |
| Interquartile 75% (IQ3) | 99.9% | 99.0% |
| Interquartile Range (IQR) | 5.0% | 1.7% |
| Standard Deviation (Sample) | 2.9% | 1.4% |
| Standard Deviation (Population) | 2.9% | 1.3% |
Similar Demographics by Kindergarten
Demographics Similar to Immigrants from Thailand by Kindergarten
In terms of kindergarten, the demographic groups most similar to Immigrants from Thailand are Immigrants from Barbados (97.3%, a difference of 0.010%), Immigrants from Hong Kong (97.3%, a difference of 0.010%), Immigrants from Portugal (97.3%, a difference of 0.020%), Immigrants from Afghanistan (97.3%, a difference of 0.020%), and Immigrants from Trinidad and Tobago (97.3%, a difference of 0.030%).
| Demographics | Rating | Rank | Kindergarten |
| Trinidadians and Tobagonians | 0.1 /100 | #281 | Tragic 97.4% |
| Afghans | 0.0 /100 | #282 | Tragic 97.4% |
| Immigrants | West Indies | 0.0 /100 | #283 | Tragic 97.3% |
| Immigrants | Trinidad and Tobago | 0.0 /100 | #284 | Tragic 97.3% |
| Immigrants | Portugal | 0.0 /100 | #285 | Tragic 97.3% |
| Immigrants | Barbados | 0.0 /100 | #286 | Tragic 97.3% |
| Immigrants | Hong Kong | 0.0 /100 | #287 | Tragic 97.3% |
| Immigrants | Thailand | 0.0 /100 | #288 | Tragic 97.3% |
| Immigrants | Afghanistan | 0.0 /100 | #289 | Tragic 97.3% |
| Immigrants | St. Vincent and the Grenadines | 0.0 /100 | #290 | Tragic 97.3% |
| Houma | 0.0 /100 | #291 | Tragic 97.3% |
| British West Indians | 0.0 /100 | #292 | Tragic 97.3% |
| Malaysians | 0.0 /100 | #293 | Tragic 97.2% |
| Immigrants | Immigrants | 0.0 /100 | #294 | Tragic 97.2% |
| Immigrants | Grenada | 0.0 /100 | #295 | Tragic 97.2% |
Demographics Similar to Yaqui by Kindergarten
In terms of kindergarten, the demographic groups most similar to Yaqui are Immigrants from Asia (97.6%, a difference of 0.0%), Immigrants from Congo (97.6%, a difference of 0.0%), Immigrants from Iraq (97.6%, a difference of 0.010%), Immigrants from Africa (97.6%, a difference of 0.010%), and Immigrants from Colombia (97.6%, a difference of 0.010%).
| Demographics | Rating | Rank | Kindergarten |
| Peruvians | 1.0 /100 | #249 | Tragic 97.6% |
| Immigrants | Senegal | 0.9 /100 | #250 | Tragic 97.6% |
| Ethiopians | 0.9 /100 | #251 | Tragic 97.6% |
| Immigrants | Iraq | 0.9 /100 | #252 | Tragic 97.6% |
| Immigrants | Africa | 0.8 /100 | #253 | Tragic 97.6% |
| Immigrants | Asia | 0.8 /100 | #254 | Tragic 97.6% |
| Immigrants | Congo | 0.8 /100 | #255 | Tragic 97.6% |
| Yaqui | 0.7 /100 | #256 | Tragic 97.6% |
| Immigrants | Colombia | 0.6 /100 | #257 | Tragic 97.6% |
| Jamaicans | 0.6 /100 | #258 | Tragic 97.6% |
| Armenians | 0.5 /100 | #259 | Tragic 97.6% |
| Fijians | 0.5 /100 | #260 | Tragic 97.5% |
| Taiwanese | 0.4 /100 | #261 | Tragic 97.5% |
| Immigrants | Ethiopia | 0.4 /100 | #262 | Tragic 97.5% |
| Immigrants | South America | 0.4 /100 | #263 | Tragic 97.5% |