Immigrants from Thailand vs Moroccan Nursery School
COMPARE
Immigrants from Thailand
Moroccan
Nursery School
Nursery School Comparison
Immigrants from Thailand
Moroccans
97.3%
NURSERY SCHOOL
0.0/ 100
METRIC RATING
288th/ 347
METRIC RANK
97.8%
NURSERY SCHOOL
8.3/ 100
METRIC RATING
213th/ 347
METRIC RANK
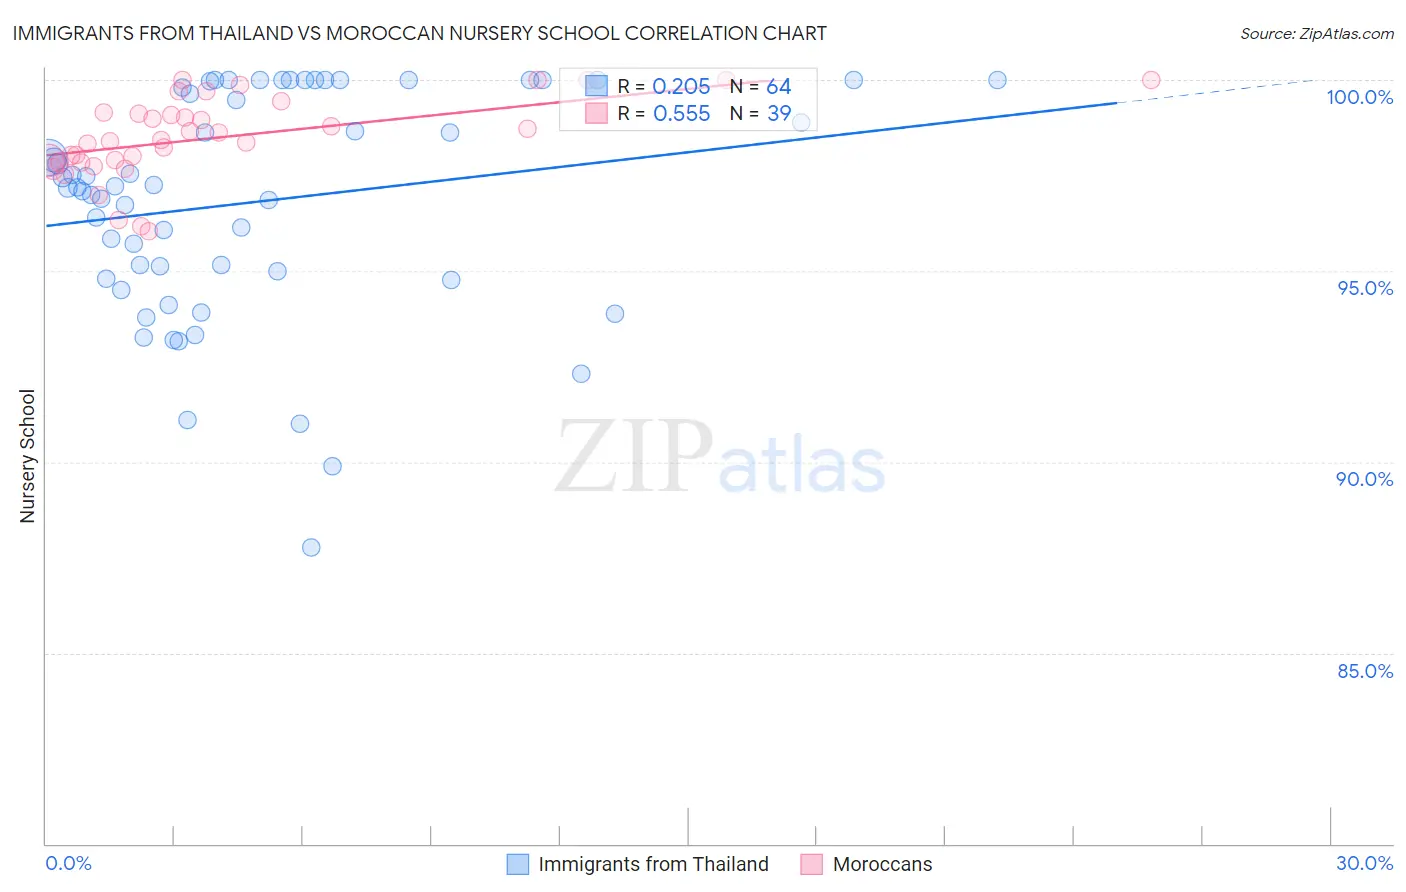
Immigrants from Thailand vs Moroccan Nursery School Correlation Chart
The statistical analysis conducted on geographies consisting of 317,003,357 people shows a weak positive correlation between the proportion of Immigrants from Thailand and percentage of population with at least nursery school education in the United States with a correlation coefficient (R) of 0.205 and weighted average of 97.3%. Similarly, the statistical analysis conducted on geographies consisting of 201,817,667 people shows a substantial positive correlation between the proportion of Moroccans and percentage of population with at least nursery school education in the United States with a correlation coefficient (R) of 0.555 and weighted average of 97.8%, a difference of 0.48%.
Nursery School Correlation Summary
| Measurement | Immigrants from Thailand | Moroccan |
| Minimum | 87.7% | 96.0% |
| Maximum | 100.0% | 100.0% |
| Range | 12.3% | 4.0% |
| Mean | 96.8% | 98.5% |
| Median | 97.2% | 98.4% |
| Interquartile 25% (IQ1) | 94.9% | 97.8% |
| Interquartile 75% (IQ3) | 99.9% | 99.1% |
| Interquartile Range (IQR) | 5.0% | 1.3% |
| Standard Deviation (Sample) | 2.9% | 1.1% |
| Standard Deviation (Population) | 2.9% | 1.0% |
Similar Demographics by Nursery School
Demographics Similar to Immigrants from Thailand by Nursery School
In terms of nursery school, the demographic groups most similar to Immigrants from Thailand are Immigrants from St. Vincent and the Grenadines (97.3%, a difference of 0.010%), Immigrants from Afghanistan (97.3%, a difference of 0.010%), Immigrants from Portugal (97.4%, a difference of 0.020%), Immigrants from Hong Kong (97.4%, a difference of 0.020%), and Immigrants from Barbados (97.4%, a difference of 0.030%).
| Demographics | Rating | Rank | Nursery School |
| Trinidadians and Tobagonians | 0.0 /100 | #281 | Tragic 97.4% |
| Afghans | 0.0 /100 | #282 | Tragic 97.4% |
| Immigrants | West Indies | 0.0 /100 | #283 | Tragic 97.4% |
| Immigrants | Trinidad and Tobago | 0.0 /100 | #284 | Tragic 97.4% |
| Immigrants | Barbados | 0.0 /100 | #285 | Tragic 97.4% |
| Immigrants | Portugal | 0.0 /100 | #286 | Tragic 97.4% |
| Immigrants | Hong Kong | 0.0 /100 | #287 | Tragic 97.4% |
| Immigrants | Thailand | 0.0 /100 | #288 | Tragic 97.3% |
| Immigrants | St. Vincent and the Grenadines | 0.0 /100 | #289 | Tragic 97.3% |
| Immigrants | Afghanistan | 0.0 /100 | #290 | Tragic 97.3% |
| British West Indians | 0.0 /100 | #291 | Tragic 97.3% |
| Houma | 0.0 /100 | #292 | Tragic 97.3% |
| Malaysians | 0.0 /100 | #293 | Tragic 97.3% |
| Immigrants | Grenada | 0.0 /100 | #294 | Tragic 97.3% |
| Immigrants | Immigrants | 0.0 /100 | #295 | Tragic 97.2% |
Demographics Similar to Moroccans by Nursery School
In terms of nursery school, the demographic groups most similar to Moroccans are Immigrants from Bahamas (97.8%, a difference of 0.0%), South American Indian (97.8%, a difference of 0.0%), Laotian (97.8%, a difference of 0.010%), Bahamian (97.8%, a difference of 0.010%), and Uruguayan (97.8%, a difference of 0.010%).
| Demographics | Rating | Rank | Nursery School |
| Immigrants | Albania | 16.4 /100 | #206 | Poor 97.9% |
| Africans | 15.4 /100 | #207 | Poor 97.9% |
| Immigrants | Northern Africa | 11.7 /100 | #208 | Poor 97.8% |
| Costa Ricans | 11.3 /100 | #209 | Poor 97.8% |
| Immigrants | Oceania | 10.2 /100 | #210 | Poor 97.8% |
| Laotians | 9.8 /100 | #211 | Tragic 97.8% |
| Immigrants | Bahamas | 8.6 /100 | #212 | Tragic 97.8% |
| Moroccans | 8.3 /100 | #213 | Tragic 97.8% |
| South American Indians | 8.0 /100 | #214 | Tragic 97.8% |
| Bahamians | 7.4 /100 | #215 | Tragic 97.8% |
| Uruguayans | 7.1 /100 | #216 | Tragic 97.8% |
| Samoans | 6.3 /100 | #217 | Tragic 97.8% |
| Immigrants | Panama | 5.3 /100 | #218 | Tragic 97.8% |
| Immigrants | Morocco | 5.1 /100 | #219 | Tragic 97.8% |
| Immigrants | Zaire | 4.4 /100 | #220 | Tragic 97.8% |