Immigrants from Thailand vs Aleut 6th Grade
COMPARE
Immigrants from Thailand
Aleut
6th Grade
6th Grade Comparison
Immigrants from Thailand
Aleuts
96.3%
6TH GRADE
0.1/ 100
METRIC RATING
278th/ 347
METRIC RANK
97.7%
6TH GRADE
99.8/ 100
METRIC RATING
55th/ 347
METRIC RANK
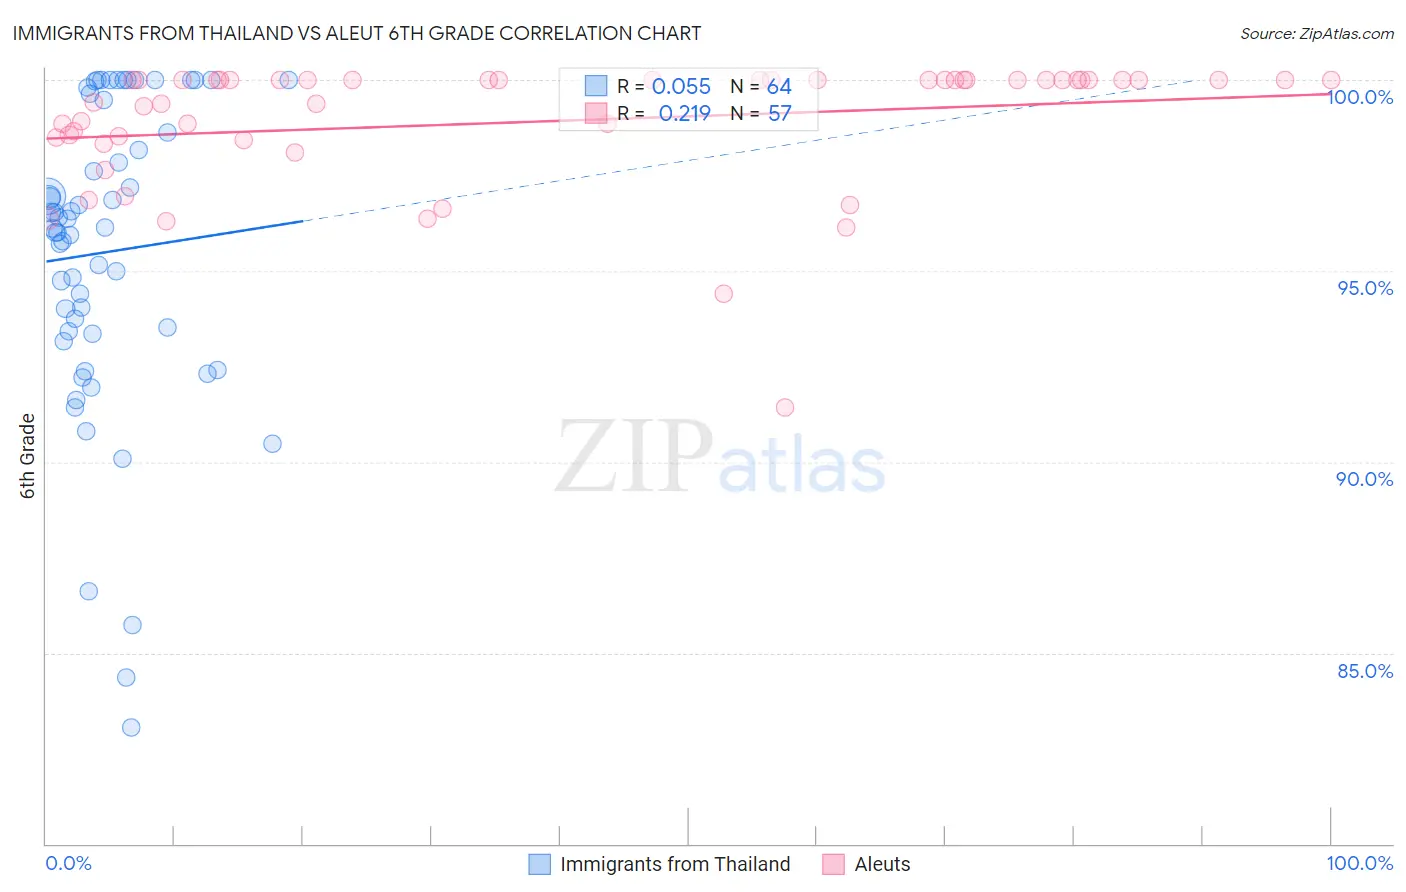
Immigrants from Thailand vs Aleut 6th Grade Correlation Chart
The statistical analysis conducted on geographies consisting of 317,022,916 people shows a slight positive correlation between the proportion of Immigrants from Thailand and percentage of population with at least 6th grade education in the United States with a correlation coefficient (R) of 0.055 and weighted average of 96.3%. Similarly, the statistical analysis conducted on geographies consisting of 61,781,058 people shows a weak positive correlation between the proportion of Aleuts and percentage of population with at least 6th grade education in the United States with a correlation coefficient (R) of 0.219 and weighted average of 97.7%, a difference of 1.5%.
6th Grade Correlation Summary
| Measurement | Immigrants from Thailand | Aleut |
| Minimum | 83.0% | 91.4% |
| Maximum | 100.0% | 100.0% |
| Range | 17.0% | 8.6% |
| Mean | 95.5% | 98.9% |
| Median | 96.1% | 100.0% |
| Interquartile 25% (IQ1) | 93.4% | 98.5% |
| Interquartile 75% (IQ3) | 99.0% | 100.0% |
| Interquartile Range (IQR) | 5.7% | 1.5% |
| Standard Deviation (Sample) | 4.0% | 1.7% |
| Standard Deviation (Population) | 4.0% | 1.7% |
Similar Demographics by 6th Grade
Demographics Similar to Immigrants from Thailand by 6th Grade
In terms of 6th grade, the demographic groups most similar to Immigrants from Thailand are Immigrants from Western Africa (96.3%, a difference of 0.0%), Yaqui (96.3%, a difference of 0.010%), Immigrants from Peru (96.2%, a difference of 0.010%), Immigrants from Ghana (96.3%, a difference of 0.020%), and Immigrants from Afghanistan (96.2%, a difference of 0.020%).
| Demographics | Rating | Rank | 6th Grade |
| Immigrants | Hong Kong | 0.2 /100 | #271 | Tragic 96.3% |
| Immigrants | Bolivia | 0.1 /100 | #272 | Tragic 96.3% |
| Immigrants | Cameroon | 0.1 /100 | #273 | Tragic 96.3% |
| Immigrants | Philippines | 0.1 /100 | #274 | Tragic 96.3% |
| Immigrants | Ghana | 0.1 /100 | #275 | Tragic 96.3% |
| Yaqui | 0.1 /100 | #276 | Tragic 96.3% |
| Immigrants | Western Africa | 0.1 /100 | #277 | Tragic 96.3% |
| Immigrants | Thailand | 0.1 /100 | #278 | Tragic 96.3% |
| Immigrants | Peru | 0.1 /100 | #279 | Tragic 96.2% |
| Immigrants | Afghanistan | 0.1 /100 | #280 | Tragic 96.2% |
| Trinidadians and Tobagonians | 0.1 /100 | #281 | Tragic 96.2% |
| Houma | 0.1 /100 | #282 | Tragic 96.2% |
| Cubans | 0.1 /100 | #283 | Tragic 96.2% |
| Fijians | 0.1 /100 | #284 | Tragic 96.2% |
| Somalis | 0.1 /100 | #285 | Tragic 96.2% |
Demographics Similar to Aleuts by 6th Grade
In terms of 6th grade, the demographic groups most similar to Aleuts are Creek (97.7%, a difference of 0.0%), Maltese (97.8%, a difference of 0.010%), Australian (97.8%, a difference of 0.010%), Slavic (97.8%, a difference of 0.010%), and Austrian (97.7%, a difference of 0.010%).
| Demographics | Rating | Rank | 6th Grade |
| Celtics | 99.9 /100 | #48 | Exceptional 97.8% |
| Estonians | 99.8 /100 | #49 | Exceptional 97.8% |
| Immigrants | Scotland | 99.8 /100 | #50 | Exceptional 97.8% |
| Maltese | 99.8 /100 | #51 | Exceptional 97.8% |
| Australians | 99.8 /100 | #52 | Exceptional 97.8% |
| Slavs | 99.8 /100 | #53 | Exceptional 97.8% |
| Creek | 99.8 /100 | #54 | Exceptional 97.7% |
| Aleuts | 99.8 /100 | #55 | Exceptional 97.7% |
| Austrians | 99.8 /100 | #56 | Exceptional 97.7% |
| Whites/Caucasians | 99.8 /100 | #57 | Exceptional 97.7% |
| Greeks | 99.8 /100 | #58 | Exceptional 97.7% |
| Americans | 99.8 /100 | #59 | Exceptional 97.7% |
| Immigrants | Canada | 99.8 /100 | #60 | Exceptional 97.7% |
| Serbians | 99.7 /100 | #61 | Exceptional 97.7% |
| Immigrants | North America | 99.7 /100 | #62 | Exceptional 97.7% |