Immigrants from Taiwan vs Peruvian 7th Grade
COMPARE
Immigrants from Taiwan
Peruvian
7th Grade
7th Grade Comparison
Immigrants from Taiwan
Peruvians
96.1%
7TH GRADE
61.5/ 100
METRIC RATING
165th/ 347
METRIC RANK
95.1%
7TH GRADE
0.2/ 100
METRIC RATING
272nd/ 347
METRIC RANK
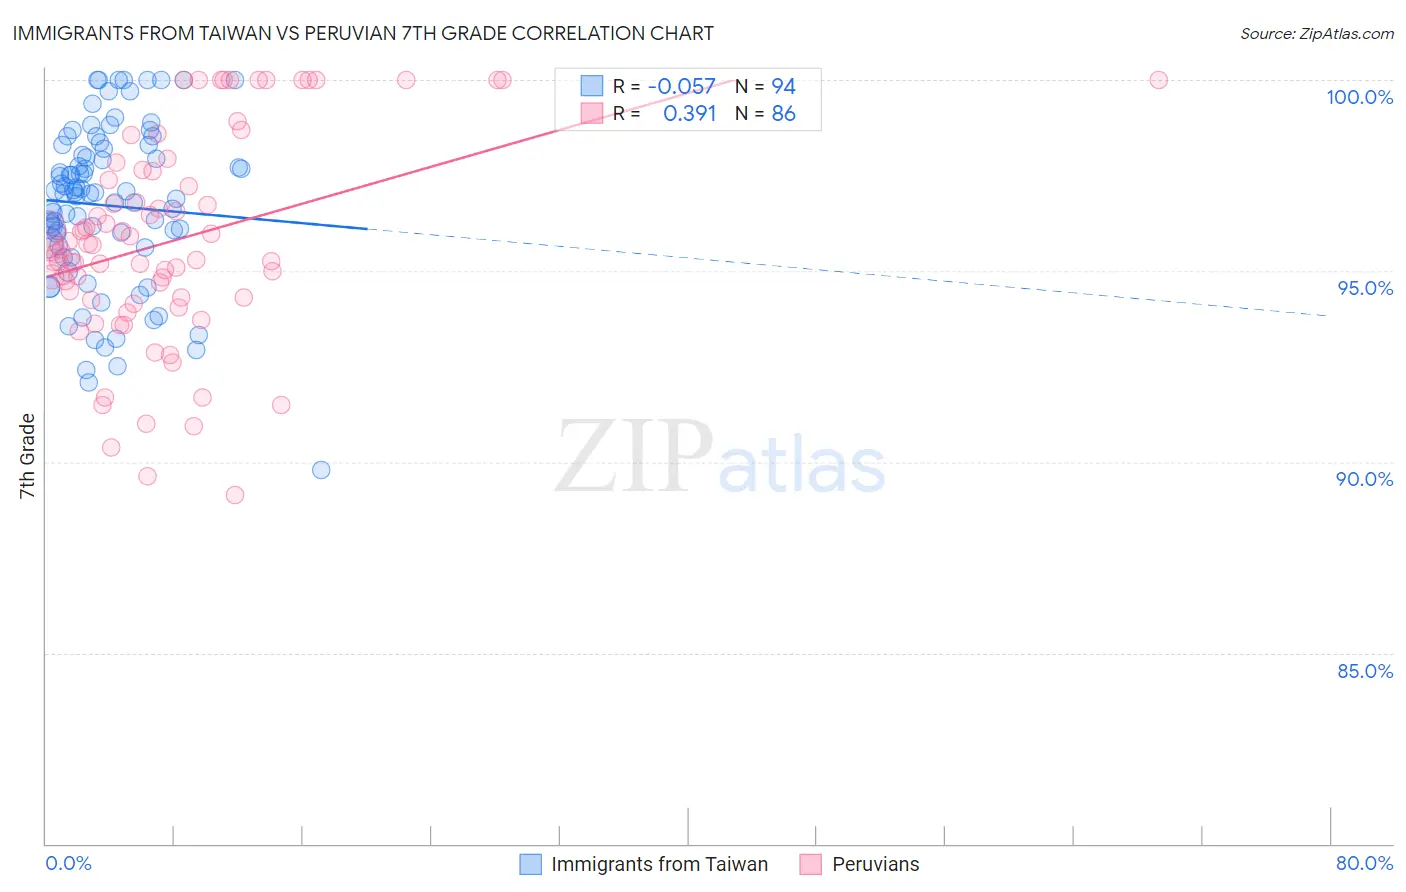
Immigrants from Taiwan vs Peruvian 7th Grade Correlation Chart
The statistical analysis conducted on geographies consisting of 298,069,199 people shows a slight negative correlation between the proportion of Immigrants from Taiwan and percentage of population with at least 7th grade education in the United States with a correlation coefficient (R) of -0.057 and weighted average of 96.1%. Similarly, the statistical analysis conducted on geographies consisting of 363,068,462 people shows a mild positive correlation between the proportion of Peruvians and percentage of population with at least 7th grade education in the United States with a correlation coefficient (R) of 0.391 and weighted average of 95.1%, a difference of 1.0%.
7th Grade Correlation Summary
| Measurement | Immigrants from Taiwan | Peruvian |
| Minimum | 89.8% | 89.1% |
| Maximum | 100.0% | 100.0% |
| Range | 10.2% | 10.9% |
| Mean | 96.7% | 95.8% |
| Median | 97.0% | 95.6% |
| Interquartile 25% (IQ1) | 95.7% | 94.3% |
| Interquartile 75% (IQ3) | 98.2% | 97.6% |
| Interquartile Range (IQR) | 2.5% | 3.3% |
| Standard Deviation (Sample) | 2.1% | 2.7% |
| Standard Deviation (Population) | 2.1% | 2.7% |
Similar Demographics by 7th Grade
Demographics Similar to Immigrants from Taiwan by 7th Grade
In terms of 7th grade, the demographic groups most similar to Immigrants from Taiwan are Immigrants from Italy (96.1%, a difference of 0.0%), Immigrants from Kazakhstan (96.1%, a difference of 0.0%), Spaniard (96.1%, a difference of 0.010%), Immigrants from Sri Lanka (96.1%, a difference of 0.010%), and Pima (96.1%, a difference of 0.020%).
| Demographics | Rating | Rank | 7th Grade |
| Arabs | 68.6 /100 | #158 | Good 96.2% |
| Alsatians | 67.2 /100 | #159 | Good 96.1% |
| Immigrants | Kenya | 66.8 /100 | #160 | Good 96.1% |
| Bermudans | 66.3 /100 | #161 | Good 96.1% |
| Pima | 64.3 /100 | #162 | Good 96.1% |
| Spaniards | 62.6 /100 | #163 | Good 96.1% |
| Immigrants | Italy | 62.1 /100 | #164 | Good 96.1% |
| Immigrants | Taiwan | 61.5 /100 | #165 | Good 96.1% |
| Immigrants | Kazakhstan | 61.0 /100 | #166 | Good 96.1% |
| Immigrants | Sri Lanka | 59.9 /100 | #167 | Average 96.1% |
| Immigrants | Poland | 59.0 /100 | #168 | Average 96.1% |
| Ute | 55.8 /100 | #169 | Average 96.1% |
| Immigrants | Ukraine | 55.0 /100 | #170 | Average 96.1% |
| Egyptians | 54.2 /100 | #171 | Average 96.1% |
| Venezuelans | 51.4 /100 | #172 | Average 96.0% |
Demographics Similar to Peruvians by 7th Grade
In terms of 7th grade, the demographic groups most similar to Peruvians are Houma (95.1%, a difference of 0.0%), Immigrants from South America (95.1%, a difference of 0.0%), Immigrants from Uzbekistan (95.1%, a difference of 0.0%), Immigrants from Western Africa (95.1%, a difference of 0.010%), and Immigrants from Colombia (95.1%, a difference of 0.010%).
| Demographics | Rating | Rank | 7th Grade |
| Immigrants | Uruguay | 0.3 /100 | #265 | Tragic 95.2% |
| Immigrants | Ghana | 0.3 /100 | #266 | Tragic 95.2% |
| Yuman | 0.3 /100 | #267 | Tragic 95.2% |
| Immigrants | Hong Kong | 0.3 /100 | #268 | Tragic 95.2% |
| Trinidadians and Tobagonians | 0.3 /100 | #269 | Tragic 95.2% |
| Houma | 0.2 /100 | #270 | Tragic 95.1% |
| Immigrants | South America | 0.2 /100 | #271 | Tragic 95.1% |
| Peruvians | 0.2 /100 | #272 | Tragic 95.1% |
| Immigrants | Uzbekistan | 0.2 /100 | #273 | Tragic 95.1% |
| Immigrants | Western Africa | 0.2 /100 | #274 | Tragic 95.1% |
| Immigrants | Colombia | 0.2 /100 | #275 | Tragic 95.1% |
| Immigrants | Thailand | 0.2 /100 | #276 | Tragic 95.1% |
| Immigrants | Afghanistan | 0.2 /100 | #277 | Tragic 95.1% |
| Immigrants | Trinidad and Tobago | 0.1 /100 | #278 | Tragic 95.1% |
| Barbadians | 0.1 /100 | #279 | Tragic 95.1% |