Immigrants from Taiwan vs Immigrants from Trinidad and Tobago 10th Grade
COMPARE
Immigrants from Taiwan
Immigrants from Trinidad and Tobago
10th Grade
10th Grade Comparison
Immigrants from Taiwan
Immigrants from Trinidad and Tobago
94.4%
10TH GRADE
95.3/ 100
METRIC RATING
120th/ 347
METRIC RANK
92.3%
10TH GRADE
0.1/ 100
METRIC RATING
276th/ 347
METRIC RANK
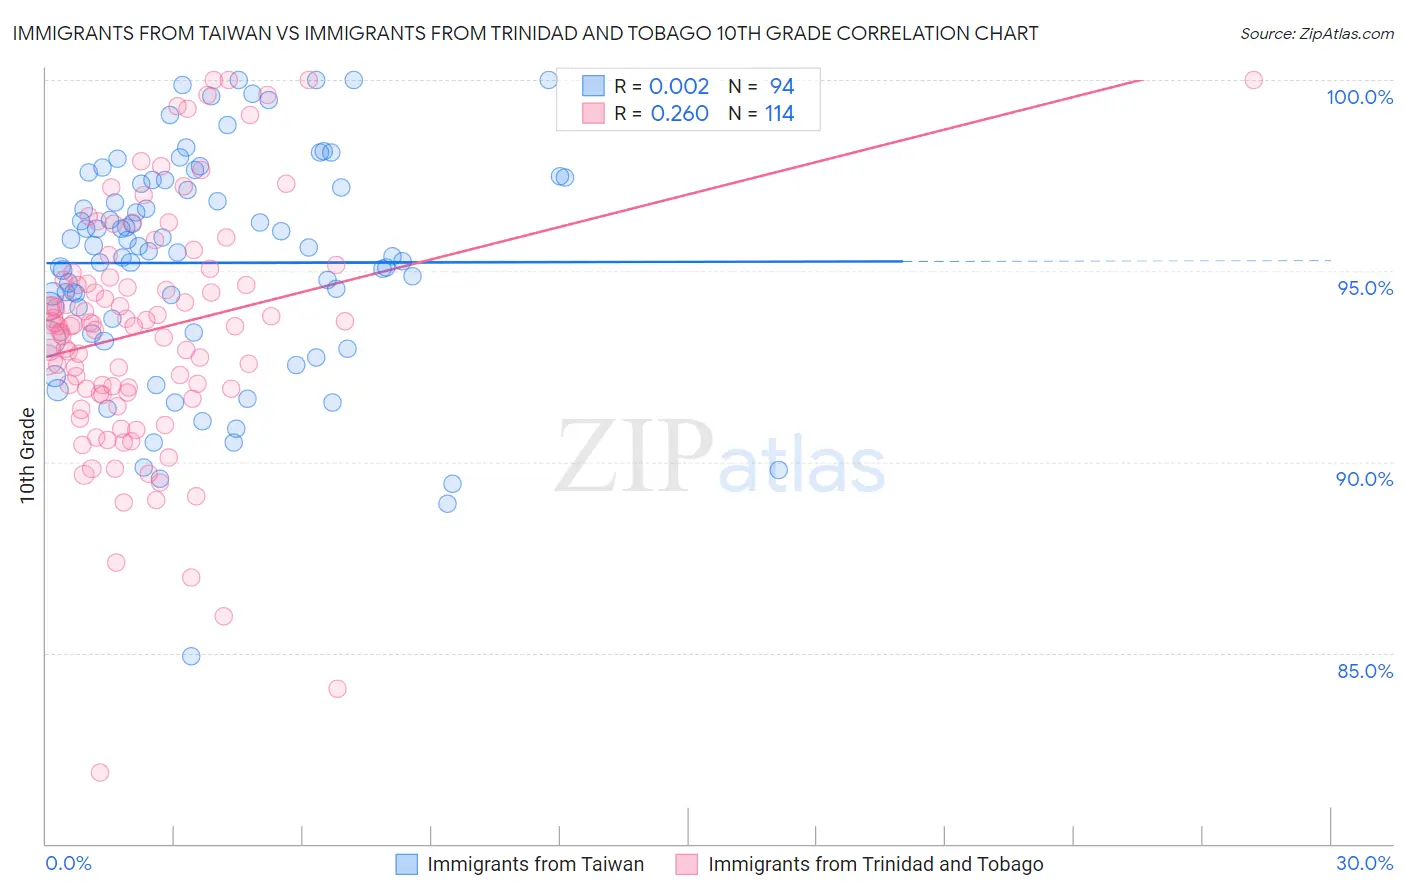
Immigrants from Taiwan vs Immigrants from Trinidad and Tobago 10th Grade Correlation Chart
The statistical analysis conducted on geographies consisting of 298,119,887 people shows no correlation between the proportion of Immigrants from Taiwan and percentage of population with at least 10th grade education in the United States with a correlation coefficient (R) of 0.002 and weighted average of 94.4%. Similarly, the statistical analysis conducted on geographies consisting of 223,526,834 people shows a weak positive correlation between the proportion of Immigrants from Trinidad and Tobago and percentage of population with at least 10th grade education in the United States with a correlation coefficient (R) of 0.260 and weighted average of 92.3%, a difference of 2.2%.
10th Grade Correlation Summary
| Measurement | Immigrants from Taiwan | Immigrants from Trinidad and Tobago |
| Minimum | 84.9% | 81.9% |
| Maximum | 100.0% | 100.0% |
| Range | 15.1% | 18.1% |
| Mean | 95.2% | 93.4% |
| Median | 95.6% | 93.6% |
| Interquartile 25% (IQ1) | 93.4% | 91.8% |
| Interquartile 75% (IQ3) | 97.4% | 94.8% |
| Interquartile Range (IQR) | 4.0% | 3.0% |
| Standard Deviation (Sample) | 2.9% | 3.2% |
| Standard Deviation (Population) | 2.9% | 3.2% |
Similar Demographics by 10th Grade
Demographics Similar to Immigrants from Taiwan by 10th Grade
In terms of 10th grade, the demographic groups most similar to Immigrants from Taiwan are Jordanian (94.4%, a difference of 0.010%), Immigrants from Israel (94.4%, a difference of 0.010%), Immigrants from Belarus (94.4%, a difference of 0.010%), Inupiat (94.4%, a difference of 0.010%), and Cree (94.4%, a difference of 0.010%).
| Demographics | Rating | Rank | 10th Grade |
| Palestinians | 96.5 /100 | #113 | Exceptional 94.4% |
| German Russians | 96.3 /100 | #114 | Exceptional 94.4% |
| Delaware | 96.3 /100 | #115 | Exceptional 94.4% |
| Sioux | 96.2 /100 | #116 | Exceptional 94.4% |
| Immigrants | Hungary | 95.8 /100 | #117 | Exceptional 94.4% |
| Jordanians | 95.6 /100 | #118 | Exceptional 94.4% |
| Immigrants | Israel | 95.4 /100 | #119 | Exceptional 94.4% |
| Immigrants | Taiwan | 95.3 /100 | #120 | Exceptional 94.4% |
| Immigrants | Belarus | 95.2 /100 | #121 | Exceptional 94.4% |
| Inupiat | 95.1 /100 | #122 | Exceptional 94.4% |
| Cree | 95.1 /100 | #123 | Exceptional 94.4% |
| Basques | 94.9 /100 | #124 | Exceptional 94.3% |
| Americans | 94.4 /100 | #125 | Exceptional 94.3% |
| Immigrants | Iran | 94.4 /100 | #126 | Exceptional 94.3% |
| Israelis | 93.8 /100 | #127 | Exceptional 94.3% |
Demographics Similar to Immigrants from Trinidad and Tobago by 10th Grade
In terms of 10th grade, the demographic groups most similar to Immigrants from Trinidad and Tobago are Navajo (92.3%, a difference of 0.070%), Barbadian (92.2%, a difference of 0.11%), West Indian (92.4%, a difference of 0.12%), Native/Alaskan (92.2%, a difference of 0.12%), and Trinidadian and Tobagonian (92.4%, a difference of 0.13%).
| Demographics | Rating | Rank | 10th Grade |
| Immigrants | Colombia | 0.3 /100 | #269 | Tragic 92.5% |
| Immigrants | Uruguay | 0.3 /100 | #270 | Tragic 92.5% |
| Immigrants | Eritrea | 0.3 /100 | #271 | Tragic 92.5% |
| Immigrants | Western Africa | 0.3 /100 | #272 | Tragic 92.5% |
| Trinidadians and Tobagonians | 0.2 /100 | #273 | Tragic 92.4% |
| Immigrants | Congo | 0.2 /100 | #274 | Tragic 92.4% |
| West Indians | 0.2 /100 | #275 | Tragic 92.4% |
| Immigrants | Trinidad and Tobago | 0.1 /100 | #276 | Tragic 92.3% |
| Navajo | 0.1 /100 | #277 | Tragic 92.3% |
| Barbadians | 0.1 /100 | #278 | Tragic 92.2% |
| Natives/Alaskans | 0.1 /100 | #279 | Tragic 92.2% |
| Malaysians | 0.1 /100 | #280 | Tragic 92.2% |
| Bangladeshis | 0.1 /100 | #281 | Tragic 92.2% |
| Immigrants | Peru | 0.1 /100 | #282 | Tragic 92.2% |
| Immigrants | St. Vincent and the Grenadines | 0.0 /100 | #283 | Tragic 92.1% |