Immigrants from Taiwan vs Eastern European College, 1 year or more
COMPARE
Immigrants from Taiwan
Eastern European
College, 1 year or more
College, 1 year or more Comparison
Immigrants from Taiwan
Eastern Europeans
69.6%
COLLEGE, 1 YEAR OR MORE
100.0/ 100
METRIC RATING
4th/ 347
METRIC RANK
66.6%
COLLEGE, 1 YEAR OR MORE
100.0/ 100
METRIC RATING
18th/ 347
METRIC RANK
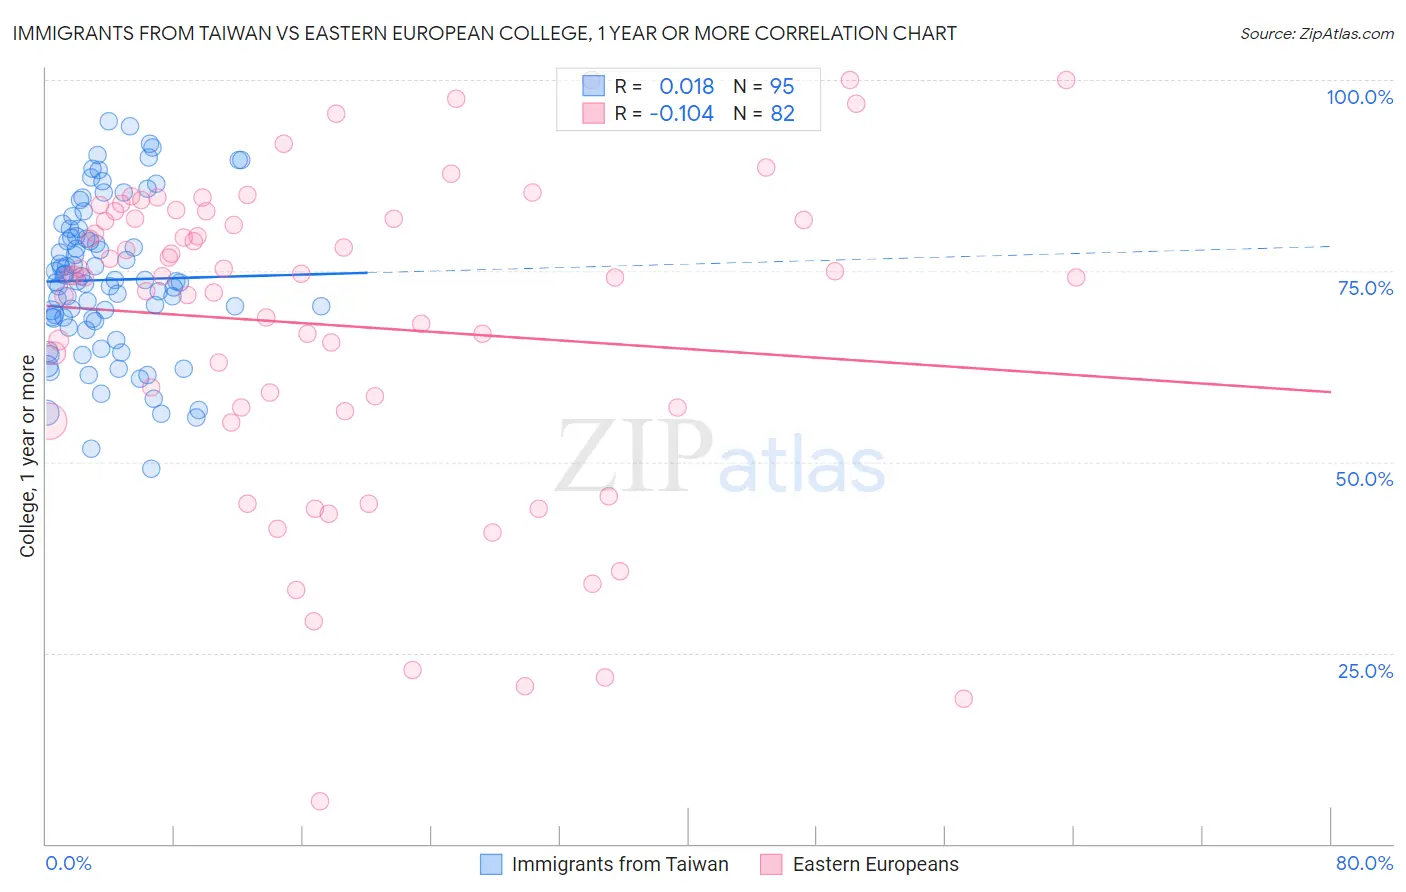
Immigrants from Taiwan vs Eastern European College, 1 year or more Correlation Chart
The statistical analysis conducted on geographies consisting of 298,289,229 people shows no correlation between the proportion of Immigrants from Taiwan and percentage of population with at least college, 1 year or more education in the United States with a correlation coefficient (R) of 0.018 and weighted average of 69.6%. Similarly, the statistical analysis conducted on geographies consisting of 461,244,598 people shows a poor negative correlation between the proportion of Eastern Europeans and percentage of population with at least college, 1 year or more education in the United States with a correlation coefficient (R) of -0.104 and weighted average of 66.6%, a difference of 4.6%.
College, 1 year or more Correlation Summary
| Measurement | Immigrants from Taiwan | Eastern European |
| Minimum | 49.1% | 5.6% |
| Maximum | 94.6% | 100.0% |
| Range | 45.6% | 94.4% |
| Mean | 73.8% | 67.9% |
| Median | 73.6% | 74.3% |
| Interquartile 25% (IQ1) | 68.5% | 57.1% |
| Interquartile 75% (IQ3) | 79.5% | 81.9% |
| Interquartile Range (IQR) | 11.1% | 24.7% |
| Standard Deviation (Sample) | 9.9% | 21.0% |
| Standard Deviation (Population) | 9.9% | 20.9% |
Demographics Similar to Immigrants from Taiwan and Eastern Europeans by College, 1 year or more
In terms of college, 1 year or more, the demographic groups most similar to Immigrants from Taiwan are Immigrants from India (69.6%, a difference of 0.0%), Immigrants from Iran (69.5%, a difference of 0.20%), Iranian (70.0%, a difference of 0.49%), Immigrants from Singapore (70.1%, a difference of 0.72%), and Okinawan (69.0%, a difference of 0.97%). Similarly, the demographic groups most similar to Eastern Europeans are Immigrants from Switzerland (66.5%, a difference of 0.050%), Immigrants from Eastern Asia (66.6%, a difference of 0.070%), Immigrants from Korea (66.5%, a difference of 0.090%), Immigrants from Hong Kong (66.4%, a difference of 0.16%), and Immigrants from Japan (66.7%, a difference of 0.19%).
| Demographics | Rating | Rank | College, 1 year or more |
| Filipinos | 100.0 /100 | #1 | Exceptional 71.0% |
| Immigrants | Singapore | 100.0 /100 | #2 | Exceptional 70.1% |
| Iranians | 100.0 /100 | #3 | Exceptional 70.0% |
| Immigrants | Taiwan | 100.0 /100 | #4 | Exceptional 69.6% |
| Immigrants | India | 100.0 /100 | #5 | Exceptional 69.6% |
| Immigrants | Iran | 100.0 /100 | #6 | Exceptional 69.5% |
| Okinawans | 100.0 /100 | #7 | Exceptional 69.0% |
| Thais | 100.0 /100 | #8 | Exceptional 68.6% |
| Immigrants | Israel | 100.0 /100 | #9 | Exceptional 67.8% |
| Immigrants | Australia | 100.0 /100 | #10 | Exceptional 67.7% |
| Immigrants | South Central Asia | 100.0 /100 | #11 | Exceptional 67.1% |
| Cypriots | 100.0 /100 | #12 | Exceptional 67.0% |
| Immigrants | Sweden | 100.0 /100 | #13 | Exceptional 66.8% |
| Burmese | 100.0 /100 | #14 | Exceptional 66.7% |
| Cambodians | 100.0 /100 | #15 | Exceptional 66.7% |
| Immigrants | Japan | 100.0 /100 | #16 | Exceptional 66.7% |
| Immigrants | Eastern Asia | 100.0 /100 | #17 | Exceptional 66.6% |
| Eastern Europeans | 100.0 /100 | #18 | Exceptional 66.6% |
| Immigrants | Switzerland | 100.0 /100 | #19 | Exceptional 66.5% |
| Immigrants | Korea | 100.0 /100 | #20 | Exceptional 66.5% |
| Immigrants | Hong Kong | 100.0 /100 | #21 | Exceptional 66.4% |