Immigrants from Taiwan vs Delaware 11th Grade
COMPARE
Immigrants from Taiwan
Delaware
11th Grade
11th Grade Comparison
Immigrants from Taiwan
Delaware
93.6%
11TH GRADE
99.3/ 100
METRIC RATING
84th/ 347
METRIC RANK
93.0%
11TH GRADE
87.3/ 100
METRIC RATING
134th/ 347
METRIC RANK
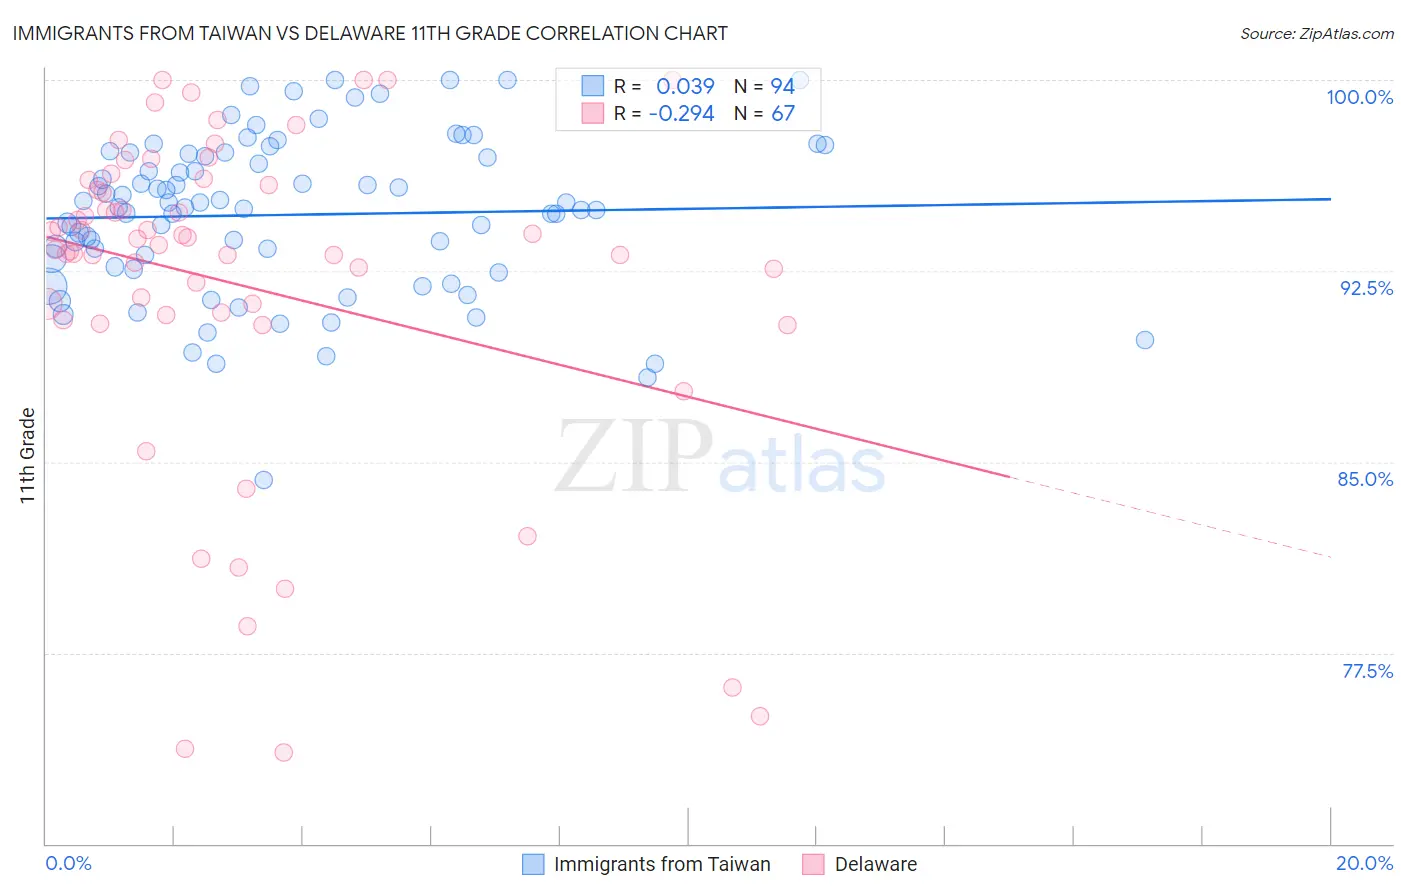
Immigrants from Taiwan vs Delaware 11th Grade Correlation Chart
The statistical analysis conducted on geographies consisting of 298,119,887 people shows no correlation between the proportion of Immigrants from Taiwan and percentage of population with at least 11th grade education in the United States with a correlation coefficient (R) of 0.039 and weighted average of 93.6%. Similarly, the statistical analysis conducted on geographies consisting of 96,234,866 people shows a weak negative correlation between the proportion of Delaware and percentage of population with at least 11th grade education in the United States with a correlation coefficient (R) of -0.294 and weighted average of 93.0%, a difference of 0.73%.
11th Grade Correlation Summary
| Measurement | Immigrants from Taiwan | Delaware |
| Minimum | 84.3% | 73.6% |
| Maximum | 100.0% | 100.0% |
| Range | 15.7% | 26.4% |
| Mean | 94.7% | 92.0% |
| Median | 95.0% | 93.5% |
| Interquartile 25% (IQ1) | 92.7% | 90.8% |
| Interquartile 75% (IQ3) | 97.1% | 95.9% |
| Interquartile Range (IQR) | 4.5% | 5.1% |
| Standard Deviation (Sample) | 3.1% | 6.5% |
| Standard Deviation (Population) | 3.1% | 6.4% |
Similar Demographics by 11th Grade
Demographics Similar to Immigrants from Taiwan by 11th Grade
In terms of 11th grade, the demographic groups most similar to Immigrants from Taiwan are Icelander (93.6%, a difference of 0.0%), Immigrants from Switzerland (93.6%, a difference of 0.0%), Immigrants from Saudi Arabia (93.7%, a difference of 0.010%), Immigrants from South Central Asia (93.6%, a difference of 0.010%), and Immigrants from Western Europe (93.6%, a difference of 0.020%).
| Demographics | Rating | Rank | 11th Grade |
| Aleuts | 99.5 /100 | #77 | Exceptional 93.7% |
| Soviet Union | 99.5 /100 | #78 | Exceptional 93.7% |
| Immigrants | Denmark | 99.5 /100 | #79 | Exceptional 93.7% |
| Canadians | 99.5 /100 | #80 | Exceptional 93.7% |
| Immigrants | Moldova | 99.5 /100 | #81 | Exceptional 93.7% |
| Immigrants | Saudi Arabia | 99.3 /100 | #82 | Exceptional 93.7% |
| Icelanders | 99.3 /100 | #83 | Exceptional 93.6% |
| Immigrants | Taiwan | 99.3 /100 | #84 | Exceptional 93.6% |
| Immigrants | Switzerland | 99.3 /100 | #85 | Exceptional 93.6% |
| Immigrants | South Central Asia | 99.2 /100 | #86 | Exceptional 93.6% |
| Immigrants | Western Europe | 99.2 /100 | #87 | Exceptional 93.6% |
| Cambodians | 99.2 /100 | #88 | Exceptional 93.6% |
| Burmese | 99.2 /100 | #89 | Exceptional 93.6% |
| Ottawa | 99.2 /100 | #90 | Exceptional 93.6% |
| South Africans | 99.2 /100 | #91 | Exceptional 93.6% |
Demographics Similar to Delaware by 11th Grade
In terms of 11th grade, the demographic groups most similar to Delaware are Mongolian (93.0%, a difference of 0.010%), Immigrants from Italy (92.9%, a difference of 0.020%), Cree (92.9%, a difference of 0.030%), Immigrants from Bosnia and Herzegovina (93.0%, a difference of 0.040%), and Arab (92.9%, a difference of 0.040%).
| Demographics | Rating | Rank | 11th Grade |
| Immigrants | Kazakhstan | 92.4 /100 | #127 | Exceptional 93.1% |
| Immigrants | Jordan | 92.4 /100 | #128 | Exceptional 93.1% |
| Immigrants | Ukraine | 89.8 /100 | #129 | Excellent 93.0% |
| Albanians | 89.5 /100 | #130 | Excellent 93.0% |
| Egyptians | 89.5 /100 | #131 | Excellent 93.0% |
| Immigrants | Bosnia and Herzegovina | 89.0 /100 | #132 | Excellent 93.0% |
| Mongolians | 87.6 /100 | #133 | Excellent 93.0% |
| Delaware | 87.3 /100 | #134 | Excellent 93.0% |
| Immigrants | Italy | 86.6 /100 | #135 | Excellent 92.9% |
| Cree | 85.9 /100 | #136 | Excellent 92.9% |
| Arabs | 85.4 /100 | #137 | Excellent 92.9% |
| Immigrants | Brazil | 85.1 /100 | #138 | Excellent 92.9% |
| Crow | 84.1 /100 | #139 | Excellent 92.9% |
| Venezuelans | 83.4 /100 | #140 | Excellent 92.9% |
| Chileans | 83.0 /100 | #141 | Excellent 92.9% |