Immigrants from Taiwan vs Cuban Associate's Degree
COMPARE
Immigrants from Taiwan
Cuban
Associate's Degree
Associate's Degree Comparison
Immigrants from Taiwan
Cubans
58.4%
ASSOCIATE'S DEGREE
100.0/ 100
METRIC RATING
4th/ 347
METRIC RANK
41.9%
ASSOCIATE'S DEGREE
0.6/ 100
METRIC RATING
254th/ 347
METRIC RANK
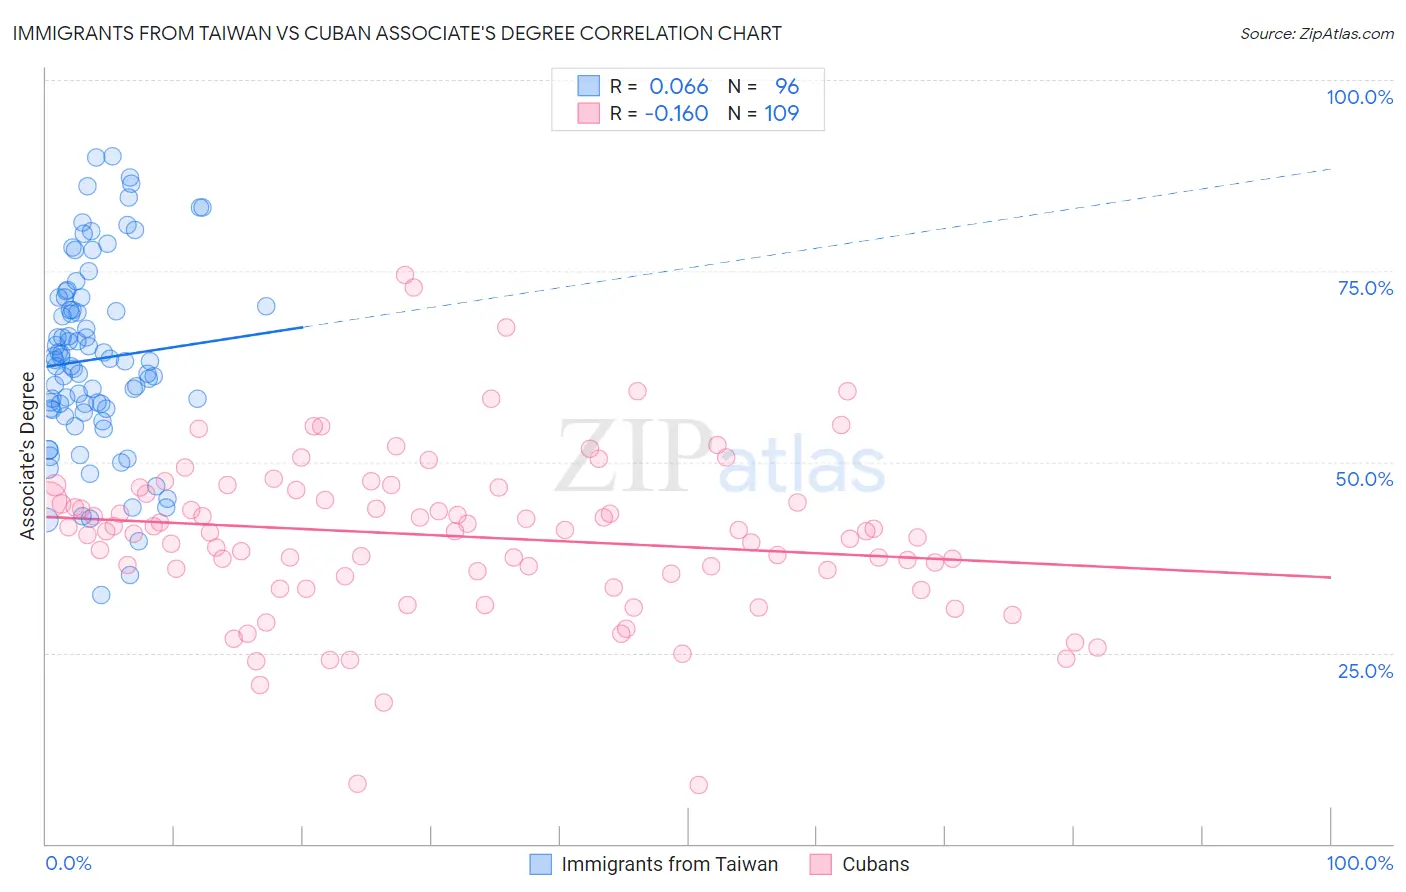
Immigrants from Taiwan vs Cuban Associate's Degree Correlation Chart
The statistical analysis conducted on geographies consisting of 298,276,858 people shows a slight positive correlation between the proportion of Immigrants from Taiwan and percentage of population with at least associate's degree education in the United States with a correlation coefficient (R) of 0.066 and weighted average of 58.4%. Similarly, the statistical analysis conducted on geographies consisting of 449,326,407 people shows a poor negative correlation between the proportion of Cubans and percentage of population with at least associate's degree education in the United States with a correlation coefficient (R) of -0.160 and weighted average of 41.9%, a difference of 39.5%.
Associate's Degree Correlation Summary
| Measurement | Immigrants from Taiwan | Cuban |
| Minimum | 32.5% | 7.8% |
| Maximum | 89.9% | 74.4% |
| Range | 57.4% | 66.7% |
| Mean | 63.4% | 40.3% |
| Median | 63.2% | 41.0% |
| Interquartile 25% (IQ1) | 56.9% | 35.1% |
| Interquartile 75% (IQ3) | 70.9% | 46.0% |
| Interquartile Range (IQR) | 14.0% | 10.9% |
| Standard Deviation (Sample) | 12.4% | 10.9% |
| Standard Deviation (Population) | 12.4% | 10.8% |
Similar Demographics by Associate's Degree
Demographics Similar to Immigrants from Taiwan by Associate's Degree
In terms of associate's degree, the demographic groups most similar to Immigrants from Taiwan are Immigrants from India (58.5%, a difference of 0.25%), Iranian (58.2%, a difference of 0.41%), Immigrants from Singapore (58.9%, a difference of 0.91%), Okinawan (57.7%, a difference of 1.2%), and Immigrants from Iran (57.7%, a difference of 1.3%).
| Demographics | Rating | Rank | Associate's Degree |
| Filipinos | 100.0 /100 | #1 | Exceptional 59.8% |
| Immigrants | Singapore | 100.0 /100 | #2 | Exceptional 58.9% |
| Immigrants | India | 100.0 /100 | #3 | Exceptional 58.5% |
| Immigrants | Taiwan | 100.0 /100 | #4 | Exceptional 58.4% |
| Iranians | 100.0 /100 | #5 | Exceptional 58.2% |
| Okinawans | 100.0 /100 | #6 | Exceptional 57.7% |
| Immigrants | Iran | 100.0 /100 | #7 | Exceptional 57.7% |
| Thais | 100.0 /100 | #8 | Exceptional 57.4% |
| Immigrants | Israel | 100.0 /100 | #9 | Exceptional 56.8% |
| Cypriots | 100.0 /100 | #10 | Exceptional 56.4% |
| Immigrants | Australia | 100.0 /100 | #11 | Exceptional 55.8% |
| Immigrants | South Central Asia | 100.0 /100 | #12 | Exceptional 55.7% |
| Immigrants | China | 100.0 /100 | #13 | Exceptional 55.5% |
| Immigrants | Hong Kong | 100.0 /100 | #14 | Exceptional 55.4% |
| Immigrants | Eastern Asia | 100.0 /100 | #15 | Exceptional 55.4% |
Demographics Similar to Cubans by Associate's Degree
In terms of associate's degree, the demographic groups most similar to Cubans are Indonesian (41.9%, a difference of 0.060%), Immigrants from Guyana (41.8%, a difference of 0.090%), French American Indian (42.0%, a difference of 0.17%), Immigrants from Congo (41.8%, a difference of 0.21%), and Spanish American (41.8%, a difference of 0.27%).
| Demographics | Rating | Rank | Associate's Degree |
| Immigrants | Fiji | 0.8 /100 | #247 | Tragic 42.2% |
| Immigrants | Ecuador | 0.8 /100 | #248 | Tragic 42.2% |
| Jamaicans | 0.7 /100 | #249 | Tragic 42.1% |
| U.S. Virgin Islanders | 0.7 /100 | #250 | Tragic 42.1% |
| Immigrants | Bahamas | 0.7 /100 | #251 | Tragic 42.1% |
| French American Indians | 0.6 /100 | #252 | Tragic 42.0% |
| Indonesians | 0.6 /100 | #253 | Tragic 41.9% |
| Cubans | 0.6 /100 | #254 | Tragic 41.9% |
| Immigrants | Guyana | 0.5 /100 | #255 | Tragic 41.8% |
| Immigrants | Congo | 0.5 /100 | #256 | Tragic 41.8% |
| Spanish Americans | 0.5 /100 | #257 | Tragic 41.8% |
| Japanese | 0.5 /100 | #258 | Tragic 41.7% |
| Malaysians | 0.4 /100 | #259 | Tragic 41.6% |
| Marshallese | 0.4 /100 | #260 | Tragic 41.6% |
| Nicaraguans | 0.4 /100 | #261 | Tragic 41.5% |