Immigrants from Taiwan vs Argentinean Kindergarten
COMPARE
Immigrants from Taiwan
Argentinean
Kindergarten
Kindergarten Comparison
Immigrants from Taiwan
Argentineans
97.9%
KINDERGARTEN
30.7/ 100
METRIC RATING
191st/ 347
METRIC RANK
97.9%
KINDERGARTEN
46.8/ 100
METRIC RATING
179th/ 347
METRIC RANK
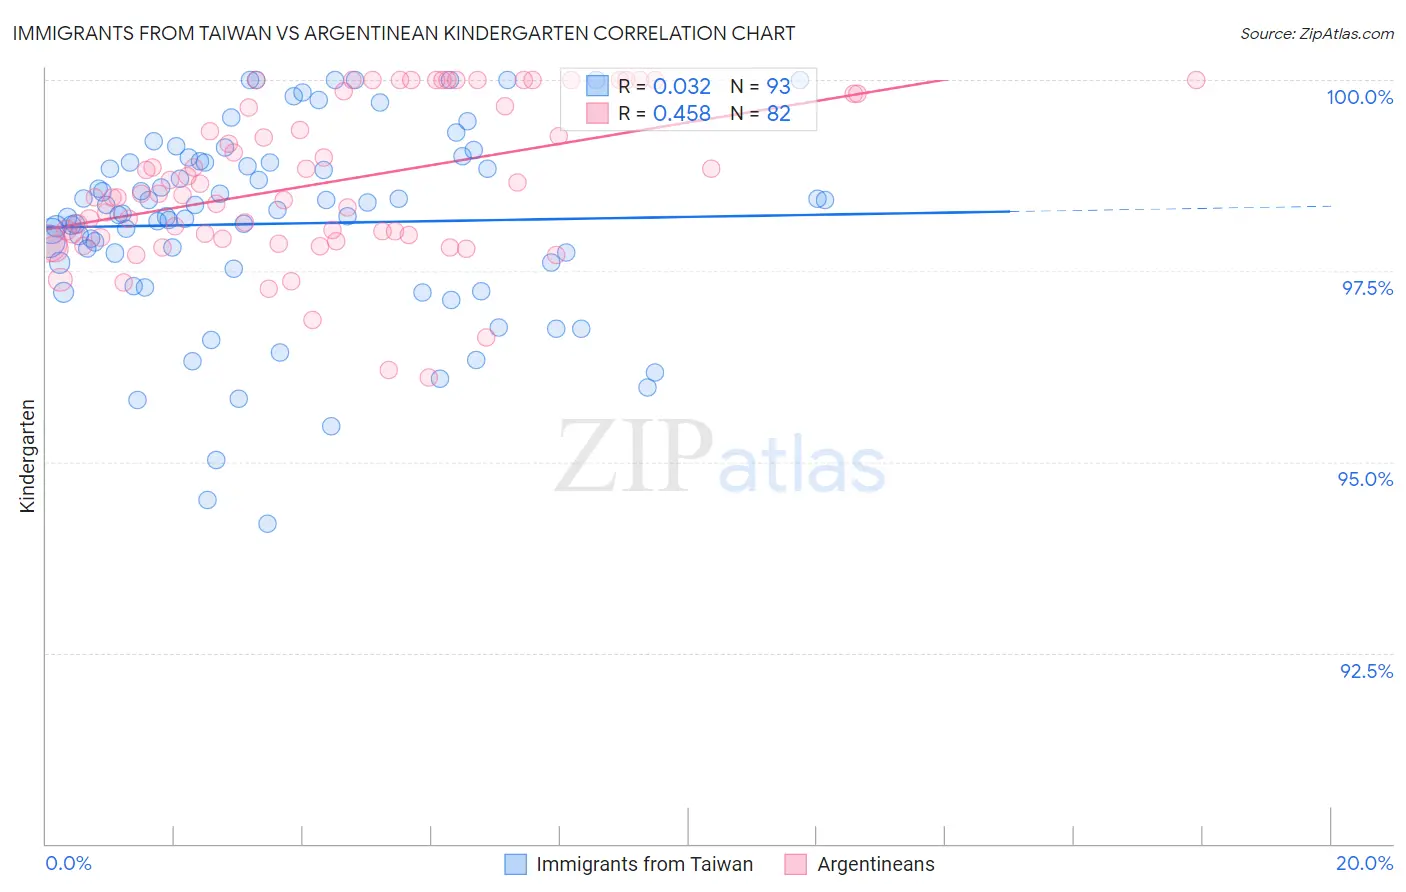
Immigrants from Taiwan vs Argentinean Kindergarten Correlation Chart
The statistical analysis conducted on geographies consisting of 298,069,082 people shows no correlation between the proportion of Immigrants from Taiwan and percentage of population with at least kindergarten education in the United States with a correlation coefficient (R) of 0.032 and weighted average of 97.9%. Similarly, the statistical analysis conducted on geographies consisting of 297,146,811 people shows a moderate positive correlation between the proportion of Argentineans and percentage of population with at least kindergarten education in the United States with a correlation coefficient (R) of 0.458 and weighted average of 97.9%, a difference of 0.050%.
Kindergarten Correlation Summary
| Measurement | Immigrants from Taiwan | Argentinean |
| Minimum | 94.2% | 96.1% |
| Maximum | 100.0% | 100.0% |
| Range | 5.8% | 3.9% |
| Mean | 98.1% | 98.7% |
| Median | 98.2% | 98.5% |
| Interquartile 25% (IQ1) | 97.6% | 97.9% |
| Interquartile 75% (IQ3) | 98.9% | 99.8% |
| Interquartile Range (IQR) | 1.4% | 1.9% |
| Standard Deviation (Sample) | 1.3% | 1.0% |
| Standard Deviation (Population) | 1.3% | 1.00% |
Demographics Similar to Immigrants from Taiwan and Argentineans by Kindergarten
In terms of kindergarten, the demographic groups most similar to Immigrants from Taiwan are Black/African American (97.9%, a difference of 0.0%), Paraguayan (97.9%, a difference of 0.0%), Paiute (97.9%, a difference of 0.010%), Panamanian (97.9%, a difference of 0.010%), and Hawaiian (97.9%, a difference of 0.010%). Similarly, the demographic groups most similar to Argentineans are Immigrants from Venezuela (97.9%, a difference of 0.0%), Brazilian (97.9%, a difference of 0.0%), Immigrants from Bosnia and Herzegovina (97.9%, a difference of 0.0%), Immigrants from Sri Lanka (97.9%, a difference of 0.010%), and Albanian (97.9%, a difference of 0.010%).
| Demographics | Rating | Rank | Kindergarten |
| Immigrants | Sri Lanka | 49.6 /100 | #175 | Average 97.9% |
| Albanians | 48.5 /100 | #176 | Average 97.9% |
| Immigrants | Venezuela | 47.9 /100 | #177 | Average 97.9% |
| Brazilians | 47.6 /100 | #178 | Average 97.9% |
| Argentineans | 46.8 /100 | #179 | Average 97.9% |
| Immigrants | Bosnia and Herzegovina | 46.7 /100 | #180 | Average 97.9% |
| Portuguese | 43.5 /100 | #181 | Average 97.9% |
| Egyptians | 42.4 /100 | #182 | Average 97.9% |
| Immigrants | Poland | 41.4 /100 | #183 | Average 97.9% |
| Immigrants | Argentina | 40.7 /100 | #184 | Average 97.9% |
| Immigrants | Belarus | 39.4 /100 | #185 | Fair 97.9% |
| Pakistanis | 36.0 /100 | #186 | Fair 97.9% |
| Immigrants | Kazakhstan | 35.9 /100 | #187 | Fair 97.9% |
| Arabs | 35.4 /100 | #188 | Fair 97.9% |
| Paiute | 34.7 /100 | #189 | Fair 97.9% |
| Panamanians | 33.3 /100 | #190 | Fair 97.9% |
| Immigrants | Taiwan | 30.7 /100 | #191 | Fair 97.9% |
| Blacks/African Americans | 29.9 /100 | #192 | Fair 97.9% |
| Paraguayans | 29.6 /100 | #193 | Fair 97.9% |
| Hawaiians | 29.3 /100 | #194 | Fair 97.9% |
| Mongolians | 28.9 /100 | #195 | Fair 97.9% |