Immigrants from Syria vs Immigrants from Albania 12th Grade, No Diploma
COMPARE
Immigrants from Syria
Immigrants from Albania
12th Grade, No Diploma
12th Grade, No Diploma Comparison
Immigrants from Syria
Immigrants from Albania
91.1%
12TH GRADE, NO DIPLOMA
40.3/ 100
METRIC RATING
180th/ 347
METRIC RANK
91.3%
12TH GRADE, NO DIPLOMA
64.1/ 100
METRIC RATING
160th/ 347
METRIC RANK
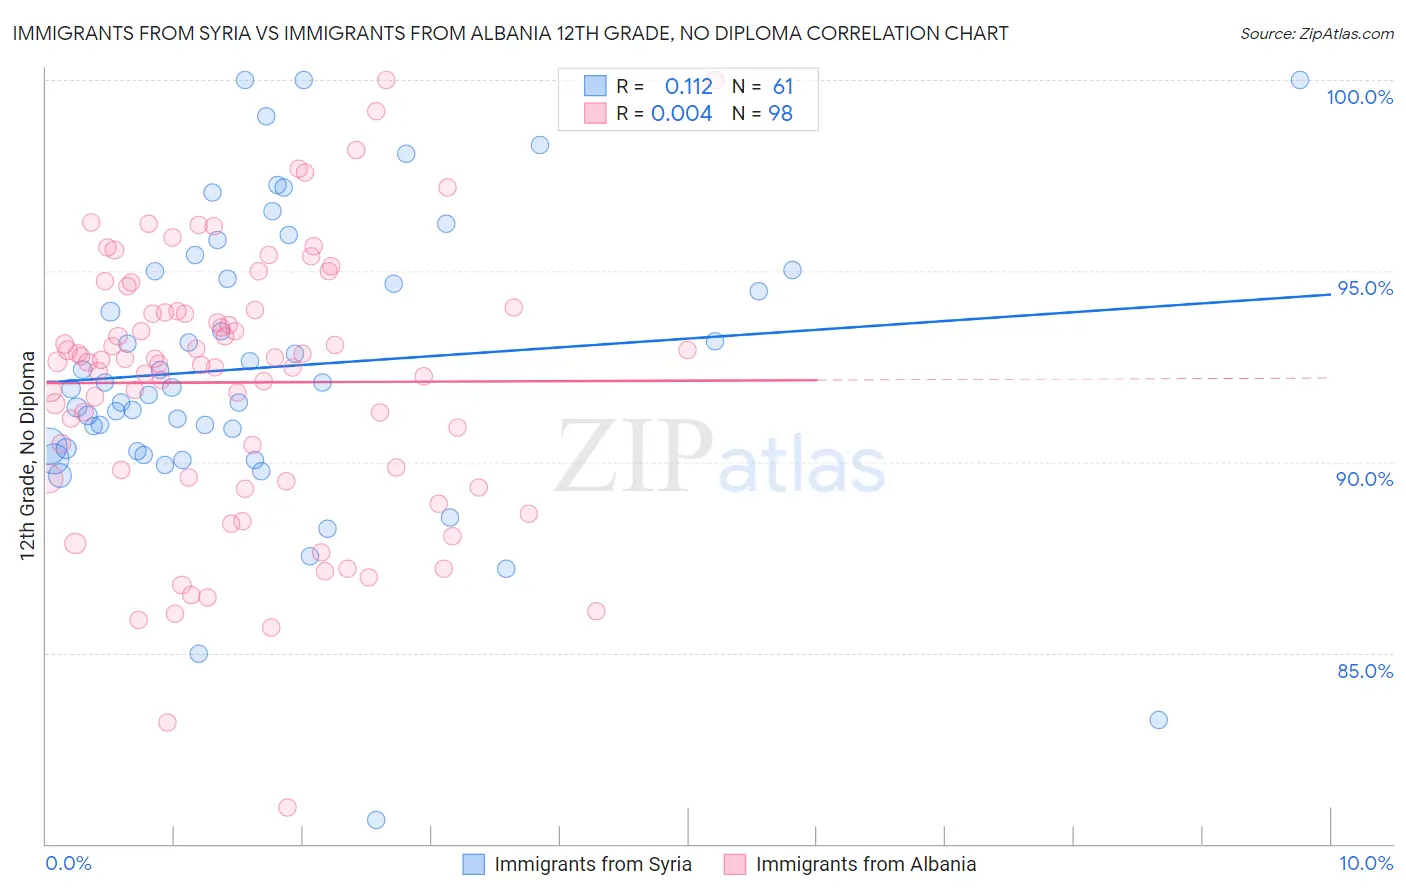
Immigrants from Syria vs Immigrants from Albania 12th Grade, No Diploma Correlation Chart
The statistical analysis conducted on geographies consisting of 174,108,882 people shows a poor positive correlation between the proportion of Immigrants from Syria and percentage of population with at least 12th grade (no diploma) education in the United States with a correlation coefficient (R) of 0.112 and weighted average of 91.1%. Similarly, the statistical analysis conducted on geographies consisting of 119,309,649 people shows no correlation between the proportion of Immigrants from Albania and percentage of population with at least 12th grade (no diploma) education in the United States with a correlation coefficient (R) of 0.004 and weighted average of 91.3%, a difference of 0.30%.
12th Grade, No Diploma Correlation Summary
| Measurement | Immigrants from Syria | Immigrants from Albania |
| Minimum | 80.6% | 81.0% |
| Maximum | 100.0% | 100.0% |
| Range | 19.4% | 19.0% |
| Mean | 92.5% | 92.1% |
| Median | 92.0% | 92.6% |
| Interquartile 25% (IQ1) | 90.3% | 89.6% |
| Interquartile 75% (IQ3) | 95.0% | 94.0% |
| Interquartile Range (IQR) | 4.7% | 4.4% |
| Standard Deviation (Sample) | 3.8% | 3.6% |
| Standard Deviation (Population) | 3.8% | 3.5% |
Demographics Similar to Immigrants from Syria and Immigrants from Albania by 12th Grade, No Diploma
In terms of 12th grade, no diploma, the demographic groups most similar to Immigrants from Syria are Spanish (91.1%, a difference of 0.040%), Immigrants from Chile (91.1%, a difference of 0.040%), Sierra Leonean (91.1%, a difference of 0.090%), Iroquois (91.1%, a difference of 0.10%), and Immigrants from Western Asia (91.2%, a difference of 0.11%). Similarly, the demographic groups most similar to Immigrants from Albania are Immigrants from Hong Kong (91.3%, a difference of 0.0%), Brazilian (91.3%, a difference of 0.030%), Immigrants from Asia (91.3%, a difference of 0.030%), Immigrants from China (91.3%, a difference of 0.040%), and Alsatian (91.3%, a difference of 0.080%).
| Demographics | Rating | Rank | 12th Grade, No Diploma |
| Immigrants | Albania | 64.1 /100 | #160 | Good 91.3% |
| Immigrants | Hong Kong | 63.8 /100 | #161 | Good 91.3% |
| Brazilians | 62.0 /100 | #162 | Good 91.3% |
| Immigrants | Asia | 61.5 /100 | #163 | Good 91.3% |
| Immigrants | China | 60.9 /100 | #164 | Good 91.3% |
| Alsatians | 58.3 /100 | #165 | Average 91.3% |
| Hmong | 58.0 /100 | #166 | Average 91.3% |
| Immigrants | Malaysia | 57.8 /100 | #167 | Average 91.3% |
| Cree | 57.0 /100 | #168 | Average 91.2% |
| Immigrants | Indonesia | 54.9 /100 | #169 | Average 91.2% |
| Delaware | 52.8 /100 | #170 | Average 91.2% |
| Immigrants | Morocco | 51.4 /100 | #171 | Average 91.2% |
| Bermudans | 50.8 /100 | #172 | Average 91.2% |
| Bolivians | 50.4 /100 | #173 | Average 91.2% |
| Immigrants | Nepal | 50.0 /100 | #174 | Average 91.2% |
| Immigrants | Western Asia | 49.0 /100 | #175 | Average 91.2% |
| Iroquois | 48.5 /100 | #176 | Average 91.1% |
| Sierra Leoneans | 47.7 /100 | #177 | Average 91.1% |
| Spanish | 43.7 /100 | #178 | Average 91.1% |
| Immigrants | Chile | 43.3 /100 | #179 | Average 91.1% |
| Immigrants | Syria | 40.3 /100 | #180 | Average 91.1% |