Immigrants from Syria vs Colville Bachelor's Degree
COMPARE
Immigrants from Syria
Colville
Bachelor's Degree
Bachelor's Degree Comparison
Immigrants from Syria
Colville
40.5%
BACHELOR'S DEGREE
94.9/ 100
METRIC RATING
119th/ 347
METRIC RANK
29.0%
BACHELOR'S DEGREE
0.0/ 100
METRIC RATING
317th/ 347
METRIC RANK
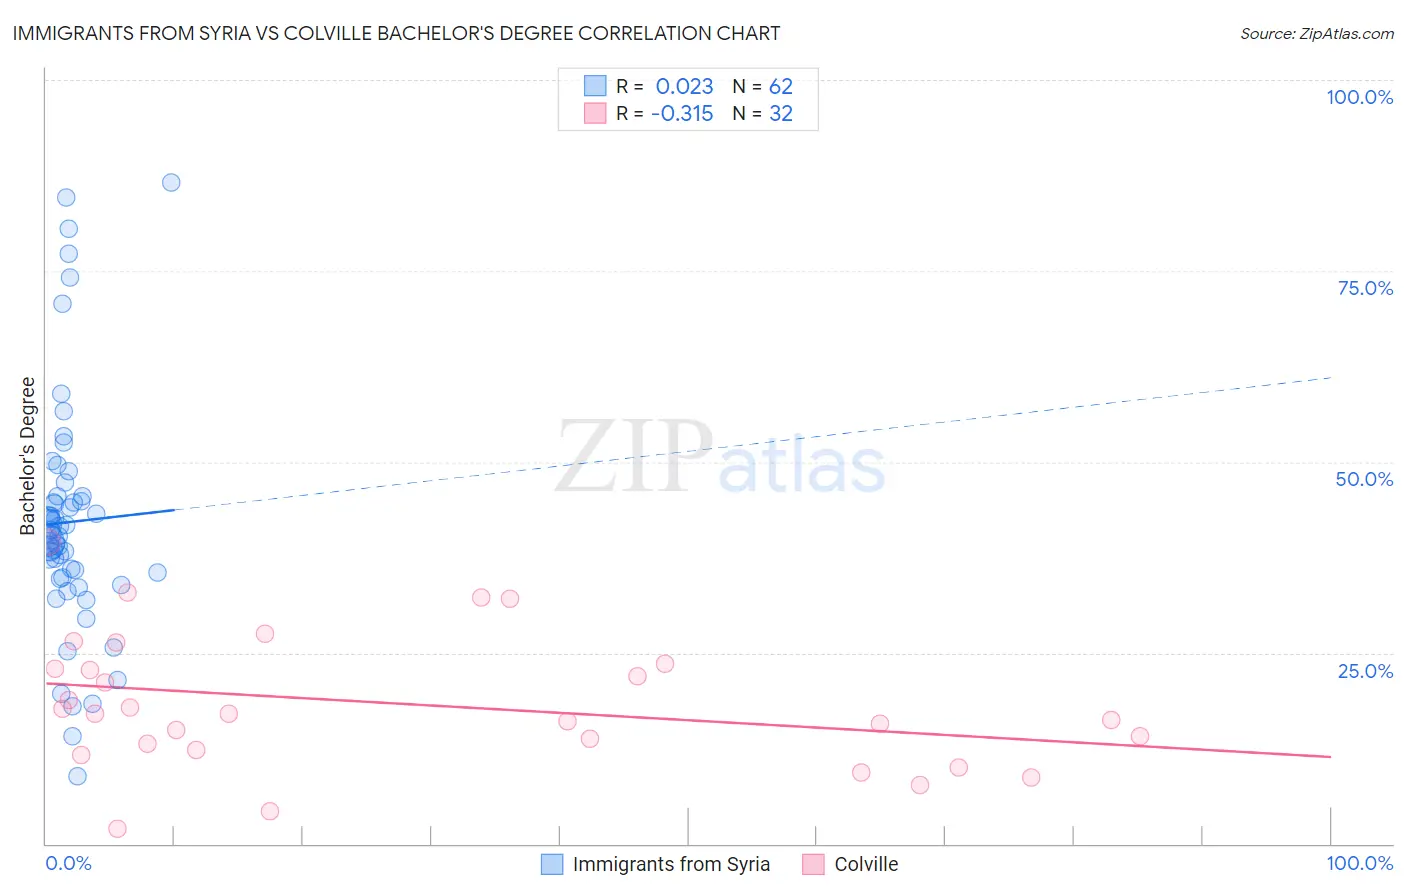
Immigrants from Syria vs Colville Bachelor's Degree Correlation Chart
The statistical analysis conducted on geographies consisting of 174,109,130 people shows no correlation between the proportion of Immigrants from Syria and percentage of population with at least bachelor's degree education in the United States with a correlation coefficient (R) of 0.023 and weighted average of 40.5%. Similarly, the statistical analysis conducted on geographies consisting of 34,683,925 people shows a mild negative correlation between the proportion of Colville and percentage of population with at least bachelor's degree education in the United States with a correlation coefficient (R) of -0.315 and weighted average of 29.0%, a difference of 39.7%.
Bachelor's Degree Correlation Summary
| Measurement | Immigrants from Syria | Colville |
| Minimum | 8.8% | 1.9% |
| Maximum | 86.6% | 39.5% |
| Range | 77.8% | 37.5% |
| Mean | 42.1% | 18.3% |
| Median | 40.3% | 17.0% |
| Interquartile 25% (IQ1) | 34.9% | 12.7% |
| Interquartile 75% (IQ3) | 45.5% | 23.2% |
| Interquartile Range (IQR) | 10.5% | 10.6% |
| Standard Deviation (Sample) | 15.6% | 8.7% |
| Standard Deviation (Population) | 15.5% | 8.6% |
Similar Demographics by Bachelor's Degree
Demographics Similar to Immigrants from Syria by Bachelor's Degree
In terms of bachelor's degree, the demographic groups most similar to Immigrants from Syria are Venezuelan (40.5%, a difference of 0.070%), Moroccan (40.5%, a difference of 0.12%), Immigrants from Albania (40.4%, a difference of 0.22%), Lebanese (40.4%, a difference of 0.24%), and Immigrants from Eritrea (40.4%, a difference of 0.24%).
| Demographics | Rating | Rank | Bachelor's Degree |
| Ugandans | 96.3 /100 | #112 | Exceptional 40.8% |
| Brazilians | 96.3 /100 | #113 | Exceptional 40.8% |
| Afghans | 96.2 /100 | #114 | Exceptional 40.8% |
| Palestinians | 95.8 /100 | #115 | Exceptional 40.7% |
| Immigrants | Uganda | 95.7 /100 | #116 | Exceptional 40.7% |
| Austrians | 95.5 /100 | #117 | Exceptional 40.6% |
| Croatians | 95.5 /100 | #118 | Exceptional 40.6% |
| Immigrants | Syria | 94.9 /100 | #119 | Exceptional 40.5% |
| Venezuelans | 94.7 /100 | #120 | Exceptional 40.5% |
| Moroccans | 94.6 /100 | #121 | Exceptional 40.5% |
| Immigrants | Albania | 94.4 /100 | #122 | Exceptional 40.4% |
| Lebanese | 94.3 /100 | #123 | Exceptional 40.4% |
| Immigrants | Eritrea | 94.3 /100 | #124 | Exceptional 40.4% |
| British | 94.2 /100 | #125 | Exceptional 40.4% |
| Immigrants | Eastern Africa | 94.1 /100 | #126 | Exceptional 40.4% |
Demographics Similar to Colville by Bachelor's Degree
In terms of bachelor's degree, the demographic groups most similar to Colville are Yaqui (29.0%, a difference of 0.050%), Sioux (29.1%, a difference of 0.20%), Creek (28.9%, a difference of 0.50%), Kiowa (28.8%, a difference of 0.55%), and Alaskan Athabascan (28.8%, a difference of 0.63%).
| Demographics | Rating | Rank | Bachelor's Degree |
| Cheyenne | 0.0 /100 | #310 | Tragic 29.4% |
| Choctaw | 0.0 /100 | #311 | Tragic 29.4% |
| Seminole | 0.0 /100 | #312 | Tragic 29.4% |
| Alaska Natives | 0.0 /100 | #313 | Tragic 29.4% |
| Shoshone | 0.0 /100 | #314 | Tragic 29.3% |
| Immigrants | Cabo Verde | 0.0 /100 | #315 | Tragic 29.2% |
| Sioux | 0.0 /100 | #316 | Tragic 29.1% |
| Colville | 0.0 /100 | #317 | Tragic 29.0% |
| Yaqui | 0.0 /100 | #318 | Tragic 29.0% |
| Creek | 0.0 /100 | #319 | Tragic 28.9% |
| Kiowa | 0.0 /100 | #320 | Tragic 28.8% |
| Alaskan Athabascans | 0.0 /100 | #321 | Tragic 28.8% |
| Tsimshian | 0.0 /100 | #322 | Tragic 28.8% |
| Fijians | 0.0 /100 | #323 | Tragic 28.7% |
| Dutch West Indians | 0.0 /100 | #324 | Tragic 28.5% |