Immigrants from Switzerland vs Native/Alaskan 11th Grade
COMPARE
Immigrants from Switzerland
Native/Alaskan
11th Grade
11th Grade Comparison
Immigrants from Switzerland
Natives/Alaskans
93.6%
11TH GRADE
99.3/ 100
METRIC RATING
85th/ 347
METRIC RANK
90.2%
11TH GRADE
0.0/ 100
METRIC RATING
293rd/ 347
METRIC RANK
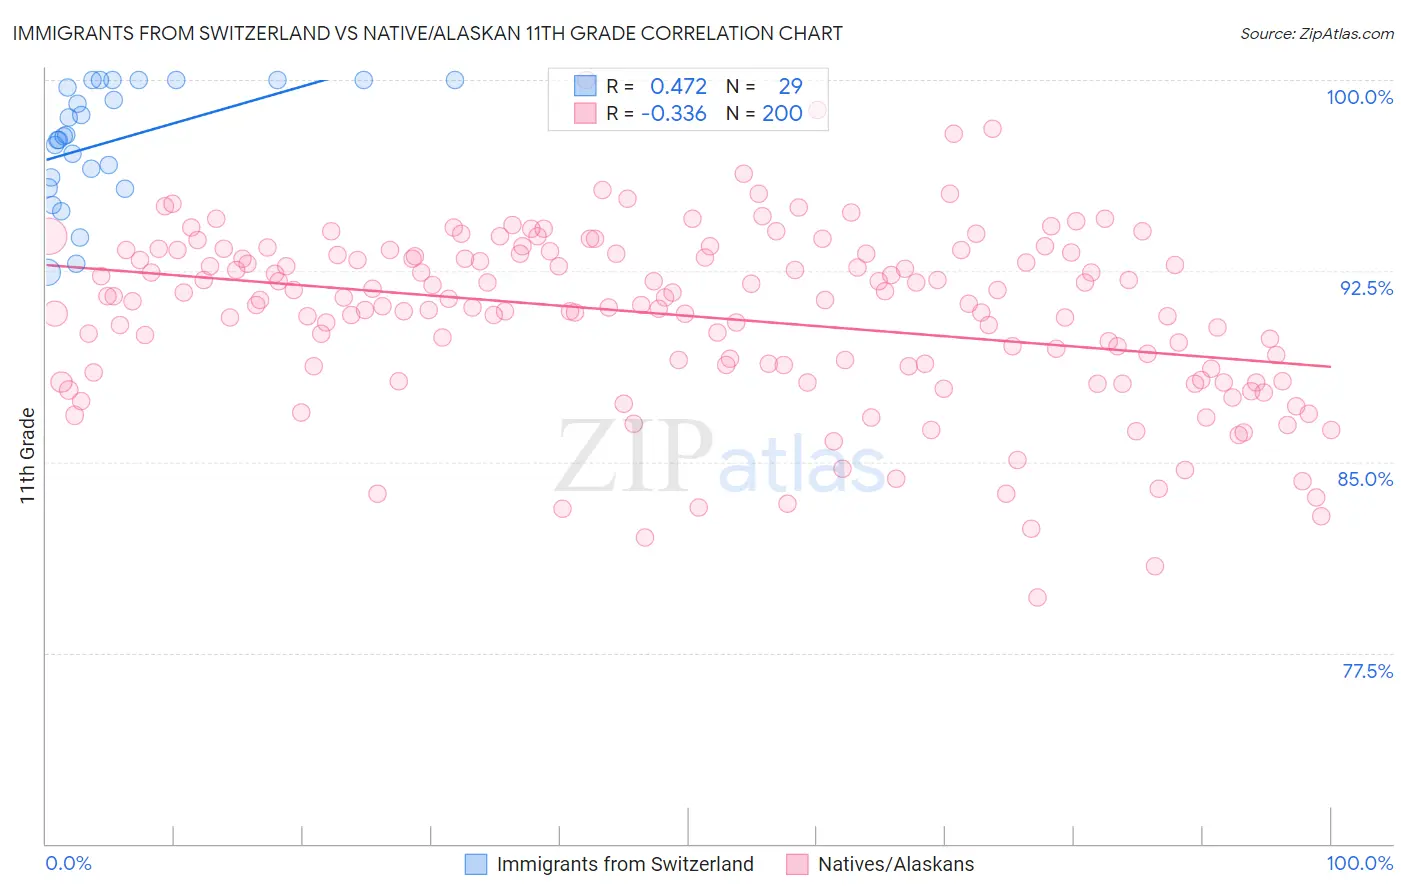
Immigrants from Switzerland vs Native/Alaskan 11th Grade Correlation Chart
The statistical analysis conducted on geographies consisting of 148,082,451 people shows a moderate positive correlation between the proportion of Immigrants from Switzerland and percentage of population with at least 11th grade education in the United States with a correlation coefficient (R) of 0.472 and weighted average of 93.6%. Similarly, the statistical analysis conducted on geographies consisting of 513,075,819 people shows a mild negative correlation between the proportion of Natives/Alaskans and percentage of population with at least 11th grade education in the United States with a correlation coefficient (R) of -0.336 and weighted average of 90.2%, a difference of 3.8%.
11th Grade Correlation Summary
| Measurement | Immigrants from Switzerland | Native/Alaskan |
| Minimum | 92.4% | 79.7% |
| Maximum | 100.0% | 100.0% |
| Range | 7.6% | 20.3% |
| Mean | 97.6% | 90.7% |
| Median | 97.8% | 91.3% |
| Interquartile 25% (IQ1) | 96.0% | 88.7% |
| Interquartile 75% (IQ3) | 100.0% | 93.2% |
| Interquartile Range (IQR) | 4.0% | 4.5% |
| Standard Deviation (Sample) | 2.3% | 3.5% |
| Standard Deviation (Population) | 2.2% | 3.4% |
Similar Demographics by 11th Grade
Demographics Similar to Immigrants from Switzerland by 11th Grade
In terms of 11th grade, the demographic groups most similar to Immigrants from Switzerland are Immigrants from Taiwan (93.6%, a difference of 0.0%), Icelander (93.6%, a difference of 0.010%), Immigrants from South Central Asia (93.6%, a difference of 0.010%), Immigrants from Western Europe (93.6%, a difference of 0.010%), and Cambodian (93.6%, a difference of 0.010%).
| Demographics | Rating | Rank | 11th Grade |
| Soviet Union | 99.5 /100 | #78 | Exceptional 93.7% |
| Immigrants | Denmark | 99.5 /100 | #79 | Exceptional 93.7% |
| Canadians | 99.5 /100 | #80 | Exceptional 93.7% |
| Immigrants | Moldova | 99.5 /100 | #81 | Exceptional 93.7% |
| Immigrants | Saudi Arabia | 99.3 /100 | #82 | Exceptional 93.7% |
| Icelanders | 99.3 /100 | #83 | Exceptional 93.6% |
| Immigrants | Taiwan | 99.3 /100 | #84 | Exceptional 93.6% |
| Immigrants | Switzerland | 99.3 /100 | #85 | Exceptional 93.6% |
| Immigrants | South Central Asia | 99.2 /100 | #86 | Exceptional 93.6% |
| Immigrants | Western Europe | 99.2 /100 | #87 | Exceptional 93.6% |
| Cambodians | 99.2 /100 | #88 | Exceptional 93.6% |
| Burmese | 99.2 /100 | #89 | Exceptional 93.6% |
| Ottawa | 99.2 /100 | #90 | Exceptional 93.6% |
| South Africans | 99.2 /100 | #91 | Exceptional 93.6% |
| Immigrants | Bulgaria | 99.1 /100 | #92 | Exceptional 93.6% |
Demographics Similar to Natives/Alaskans by 11th Grade
In terms of 11th grade, the demographic groups most similar to Natives/Alaskans are Immigrants from Grenada (90.1%, a difference of 0.050%), Cuban (90.2%, a difference of 0.070%), Haitian (90.3%, a difference of 0.10%), Indonesian (90.3%, a difference of 0.14%), and Immigrants from Vietnam (90.0%, a difference of 0.15%).
| Demographics | Rating | Rank | 11th Grade |
| Immigrants | West Indies | 0.0 /100 | #286 | Tragic 90.4% |
| Apache | 0.0 /100 | #287 | Tragic 90.4% |
| Pennsylvania Germans | 0.0 /100 | #288 | Tragic 90.3% |
| British West Indians | 0.0 /100 | #289 | Tragic 90.3% |
| Indonesians | 0.0 /100 | #290 | Tragic 90.3% |
| Haitians | 0.0 /100 | #291 | Tragic 90.3% |
| Cubans | 0.0 /100 | #292 | Tragic 90.2% |
| Natives/Alaskans | 0.0 /100 | #293 | Tragic 90.2% |
| Immigrants | Grenada | 0.0 /100 | #294 | Tragic 90.1% |
| Immigrants | Vietnam | 0.0 /100 | #295 | Tragic 90.0% |
| Fijians | 0.0 /100 | #296 | Tragic 90.0% |
| Navajo | 0.0 /100 | #297 | Tragic 90.0% |
| Immigrants | Fiji | 0.0 /100 | #298 | Tragic 89.9% |
| Japanese | 0.0 /100 | #299 | Tragic 89.9% |
| Immigrants | Haiti | 0.0 /100 | #300 | Tragic 89.9% |