Immigrants from Switzerland vs Immigrants from Croatia 3rd Grade
COMPARE
Immigrants from Switzerland
Immigrants from Croatia
3rd Grade
3rd Grade Comparison
Immigrants from Switzerland
Immigrants from Croatia
98.0%
3RD GRADE
96.6/ 100
METRIC RATING
110th/ 347
METRIC RANK
98.0%
3RD GRADE
94.4/ 100
METRIC RATING
120th/ 347
METRIC RANK
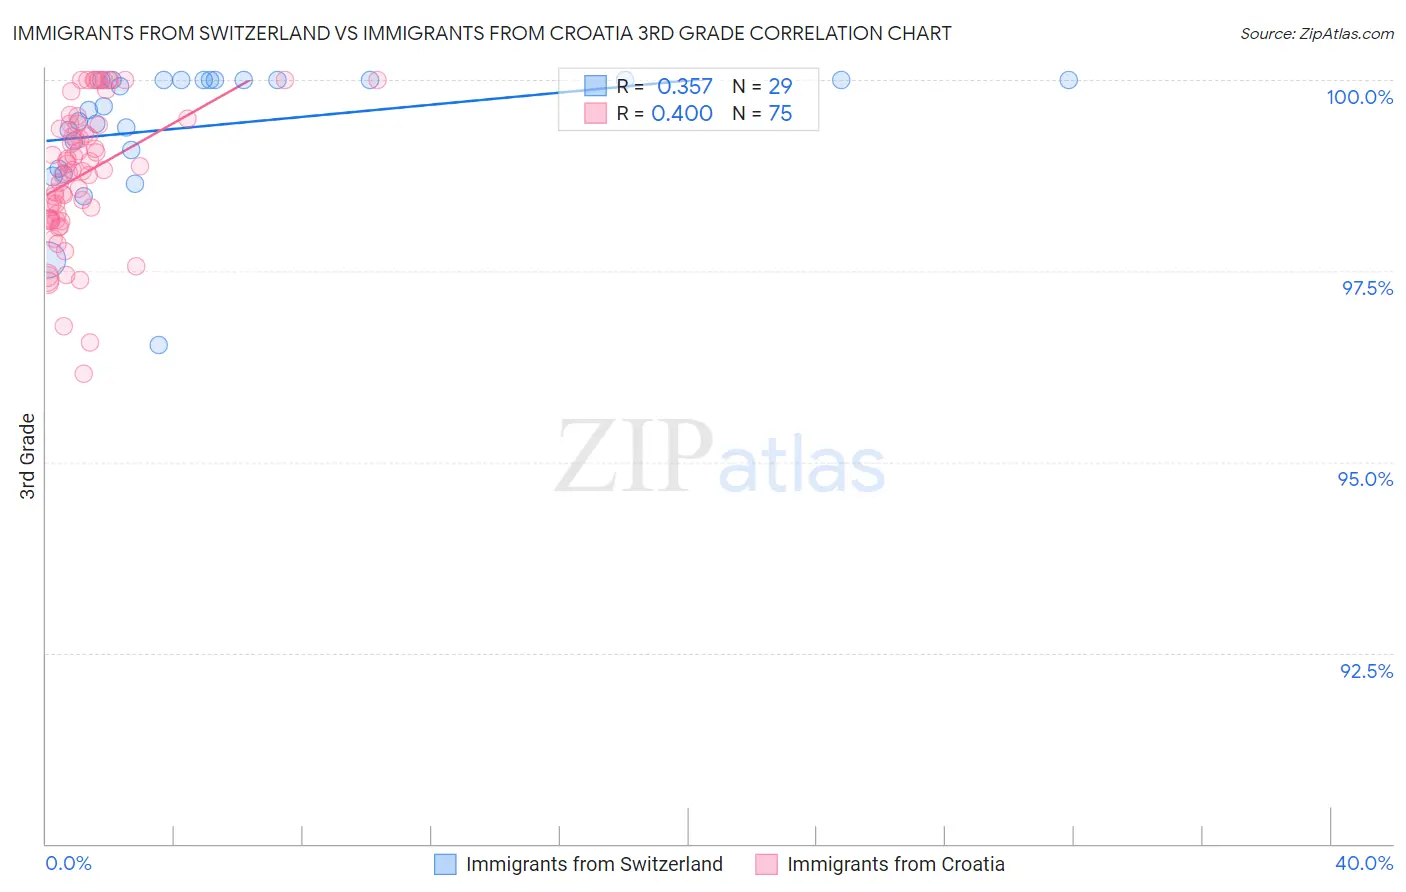
Immigrants from Switzerland vs Immigrants from Croatia 3rd Grade Correlation Chart
The statistical analysis conducted on geographies consisting of 148,082,451 people shows a mild positive correlation between the proportion of Immigrants from Switzerland and percentage of population with at least 3rd grade education in the United States with a correlation coefficient (R) of 0.357 and weighted average of 98.0%. Similarly, the statistical analysis conducted on geographies consisting of 132,508,207 people shows a mild positive correlation between the proportion of Immigrants from Croatia and percentage of population with at least 3rd grade education in the United States with a correlation coefficient (R) of 0.400 and weighted average of 98.0%, a difference of 0.050%.
3rd Grade Correlation Summary
| Measurement | Immigrants from Switzerland | Immigrants from Croatia |
| Minimum | 96.5% | 96.1% |
| Maximum | 100.0% | 100.0% |
| Range | 3.5% | 3.9% |
| Mean | 99.4% | 98.8% |
| Median | 99.7% | 98.8% |
| Interquartile 25% (IQ1) | 99.0% | 98.2% |
| Interquartile 75% (IQ3) | 100.0% | 99.4% |
| Interquartile Range (IQR) | 1.0% | 1.3% |
| Standard Deviation (Sample) | 0.83% | 0.90% |
| Standard Deviation (Population) | 0.81% | 0.89% |
Demographics Similar to Immigrants from Switzerland and Immigrants from Croatia by 3rd Grade
In terms of 3rd grade, the demographic groups most similar to Immigrants from Switzerland are Immigrants from Singapore (98.0%, a difference of 0.0%), Pima (98.0%, a difference of 0.0%), Basque (98.0%, a difference of 0.0%), Bhutanese (98.1%, a difference of 0.010%), and Immigrants from Czechoslovakia (98.0%, a difference of 0.010%). Similarly, the demographic groups most similar to Immigrants from Croatia are Iroquois (98.0%, a difference of 0.0%), Lebanese (98.0%, a difference of 0.0%), Okinawan (98.0%, a difference of 0.010%), Immigrants from Norway (98.0%, a difference of 0.010%), and Immigrants from France (98.0%, a difference of 0.010%).
| Demographics | Rating | Rank | 3rd Grade |
| German Russians | 97.2 /100 | #105 | Exceptional 98.1% |
| Bhutanese | 97.2 /100 | #106 | Exceptional 98.1% |
| Immigrants | Czechoslovakia | 97.0 /100 | #107 | Exceptional 98.0% |
| Immigrants | Singapore | 96.7 /100 | #108 | Exceptional 98.0% |
| Pima | 96.7 /100 | #109 | Exceptional 98.0% |
| Immigrants | Switzerland | 96.6 /100 | #110 | Exceptional 98.0% |
| Basques | 96.5 /100 | #111 | Exceptional 98.0% |
| Immigrants | Latvia | 96.0 /100 | #112 | Exceptional 98.0% |
| Thais | 95.5 /100 | #113 | Exceptional 98.0% |
| Menominee | 95.4 /100 | #114 | Exceptional 98.0% |
| Okinawans | 95.2 /100 | #115 | Exceptional 98.0% |
| Immigrants | Norway | 95.2 /100 | #116 | Exceptional 98.0% |
| Immigrants | France | 95.1 /100 | #117 | Exceptional 98.0% |
| Iranians | 94.9 /100 | #118 | Exceptional 98.0% |
| Spanish | 94.8 /100 | #119 | Exceptional 98.0% |
| Immigrants | Croatia | 94.4 /100 | #120 | Exceptional 98.0% |
| Iroquois | 94.1 /100 | #121 | Exceptional 98.0% |
| Lebanese | 94.1 /100 | #122 | Exceptional 98.0% |
| Syrians | 93.8 /100 | #123 | Exceptional 98.0% |
| Immigrants | Japan | 93.7 /100 | #124 | Exceptional 98.0% |
| Immigrants | Saudi Arabia | 93.5 /100 | #125 | Exceptional 98.0% |