Immigrants from Switzerland vs Immigrants from Bulgaria 10th Grade
COMPARE
Immigrants from Switzerland
Immigrants from Bulgaria
10th Grade
10th Grade Comparison
Immigrants from Switzerland
Immigrants from Bulgaria
94.6%
10TH GRADE
98.3/ 100
METRIC RATING
96th/ 347
METRIC RANK
94.6%
10TH GRADE
98.1/ 100
METRIC RATING
98th/ 347
METRIC RANK
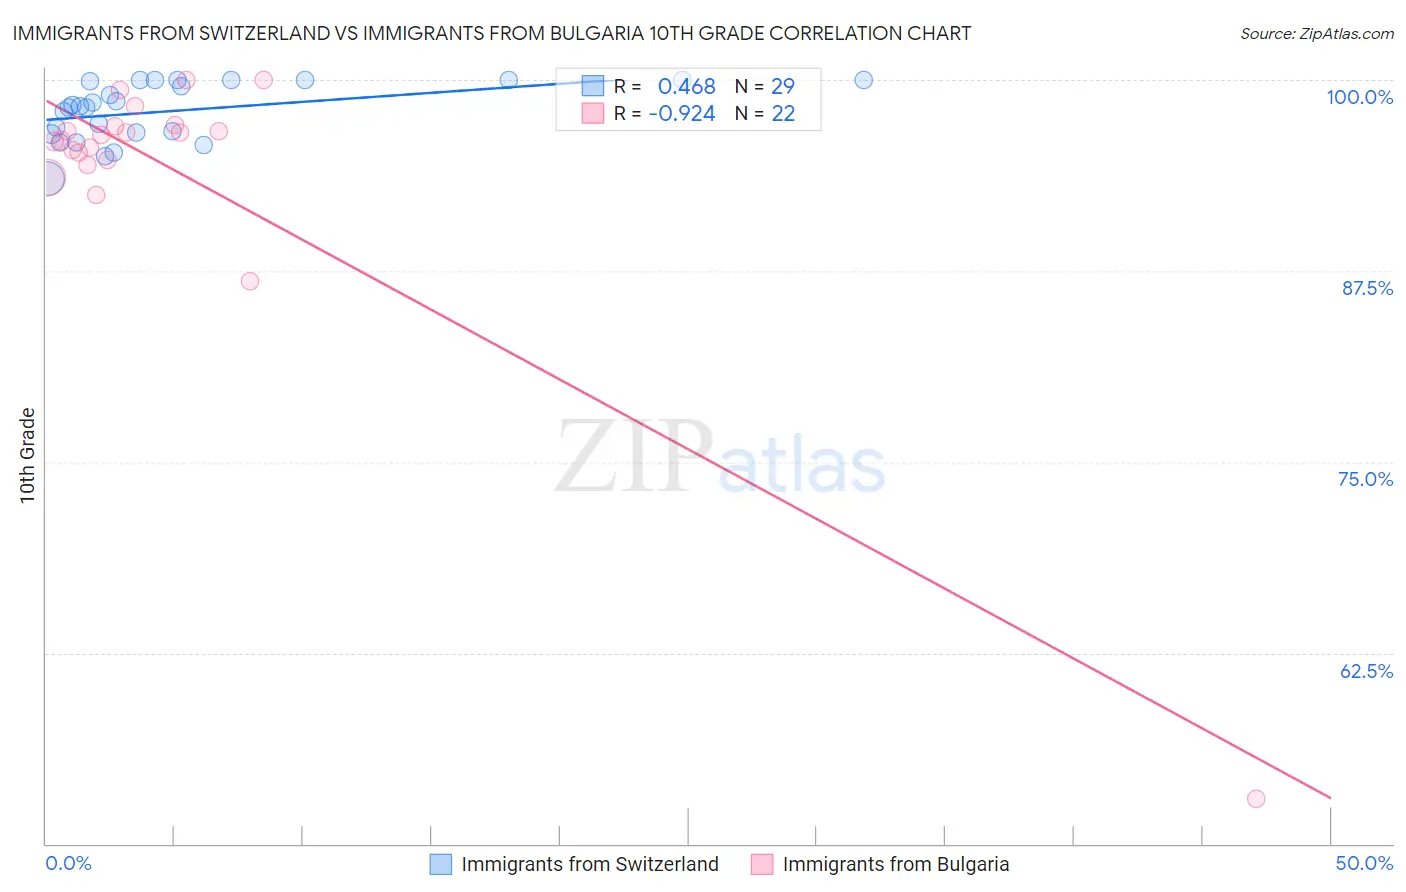
Immigrants from Switzerland vs Immigrants from Bulgaria 10th Grade Correlation Chart
The statistical analysis conducted on geographies consisting of 148,082,451 people shows a moderate positive correlation between the proportion of Immigrants from Switzerland and percentage of population with at least 10th grade education in the United States with a correlation coefficient (R) of 0.468 and weighted average of 94.6%. Similarly, the statistical analysis conducted on geographies consisting of 172,552,181 people shows a near-perfect negative correlation between the proportion of Immigrants from Bulgaria and percentage of population with at least 10th grade education in the United States with a correlation coefficient (R) of -0.924 and weighted average of 94.6%, a difference of 0.030%.
10th Grade Correlation Summary
| Measurement | Immigrants from Switzerland | Immigrants from Bulgaria |
| Minimum | 93.5% | 52.9% |
| Maximum | 100.0% | 100.0% |
| Range | 6.5% | 47.1% |
| Mean | 98.0% | 94.0% |
| Median | 98.3% | 96.2% |
| Interquartile 25% (IQ1) | 96.5% | 94.8% |
| Interquartile 75% (IQ3) | 100.0% | 97.0% |
| Interquartile Range (IQR) | 3.5% | 2.2% |
| Standard Deviation (Sample) | 1.9% | 9.6% |
| Standard Deviation (Population) | 1.8% | 9.4% |
Demographics Similar to Immigrants from Switzerland and Immigrants from Bulgaria by 10th Grade
In terms of 10th grade, the demographic groups most similar to Immigrants from Switzerland are Immigrants from Germany (94.6%, a difference of 0.0%), Menominee (94.6%, a difference of 0.0%), Lebanese (94.6%, a difference of 0.0%), Soviet Union (94.6%, a difference of 0.010%), and Yugoslavian (94.6%, a difference of 0.020%). Similarly, the demographic groups most similar to Immigrants from Bulgaria are Immigrants from France (94.5%, a difference of 0.020%), Soviet Union (94.6%, a difference of 0.030%), Immigrants from Germany (94.6%, a difference of 0.030%), Menominee (94.6%, a difference of 0.030%), and Lebanese (94.6%, a difference of 0.030%).
| Demographics | Rating | Rank | 10th Grade |
| Immigrants | Saudi Arabia | 99.0 /100 | #87 | Exceptional 94.7% |
| Immigrants | Japan | 99.0 /100 | #88 | Exceptional 94.7% |
| Immigrants | Moldova | 98.9 /100 | #89 | Exceptional 94.7% |
| South Africans | 98.8 /100 | #90 | Exceptional 94.7% |
| Whites/Caucasians | 98.8 /100 | #91 | Exceptional 94.7% |
| Yugoslavians | 98.4 /100 | #92 | Exceptional 94.6% |
| Soviet Union | 98.3 /100 | #93 | Exceptional 94.6% |
| Immigrants | Germany | 98.3 /100 | #94 | Exceptional 94.6% |
| Menominee | 98.3 /100 | #95 | Exceptional 94.6% |
| Immigrants | Switzerland | 98.3 /100 | #96 | Exceptional 94.6% |
| Lebanese | 98.3 /100 | #97 | Exceptional 94.6% |
| Immigrants | Bulgaria | 98.1 /100 | #98 | Exceptional 94.6% |
| Immigrants | France | 97.9 /100 | #99 | Exceptional 94.5% |
| Immigrants | South Central Asia | 97.8 /100 | #100 | Exceptional 94.5% |
| Syrians | 97.7 /100 | #101 | Exceptional 94.5% |
| Cambodians | 97.6 /100 | #102 | Exceptional 94.5% |
| Immigrants | Europe | 97.5 /100 | #103 | Exceptional 94.5% |
| Immigrants | Romania | 97.5 /100 | #104 | Exceptional 94.5% |
| Immigrants | Turkey | 97.4 /100 | #105 | Exceptional 94.5% |
| Immigrants | Serbia | 97.4 /100 | #106 | Exceptional 94.5% |
| Immigrants | Croatia | 97.4 /100 | #107 | Exceptional 94.5% |