Immigrants from Sweden vs Immigrants from Brazil 10th Grade
COMPARE
Immigrants from Sweden
Immigrants from Brazil
10th Grade
10th Grade Comparison
Immigrants from Sweden
Immigrants from Brazil
94.9%
10TH GRADE
99.6/ 100
METRIC RATING
72nd/ 347
METRIC RANK
94.0%
10TH GRADE
75.5/ 100
METRIC RATING
153rd/ 347
METRIC RANK
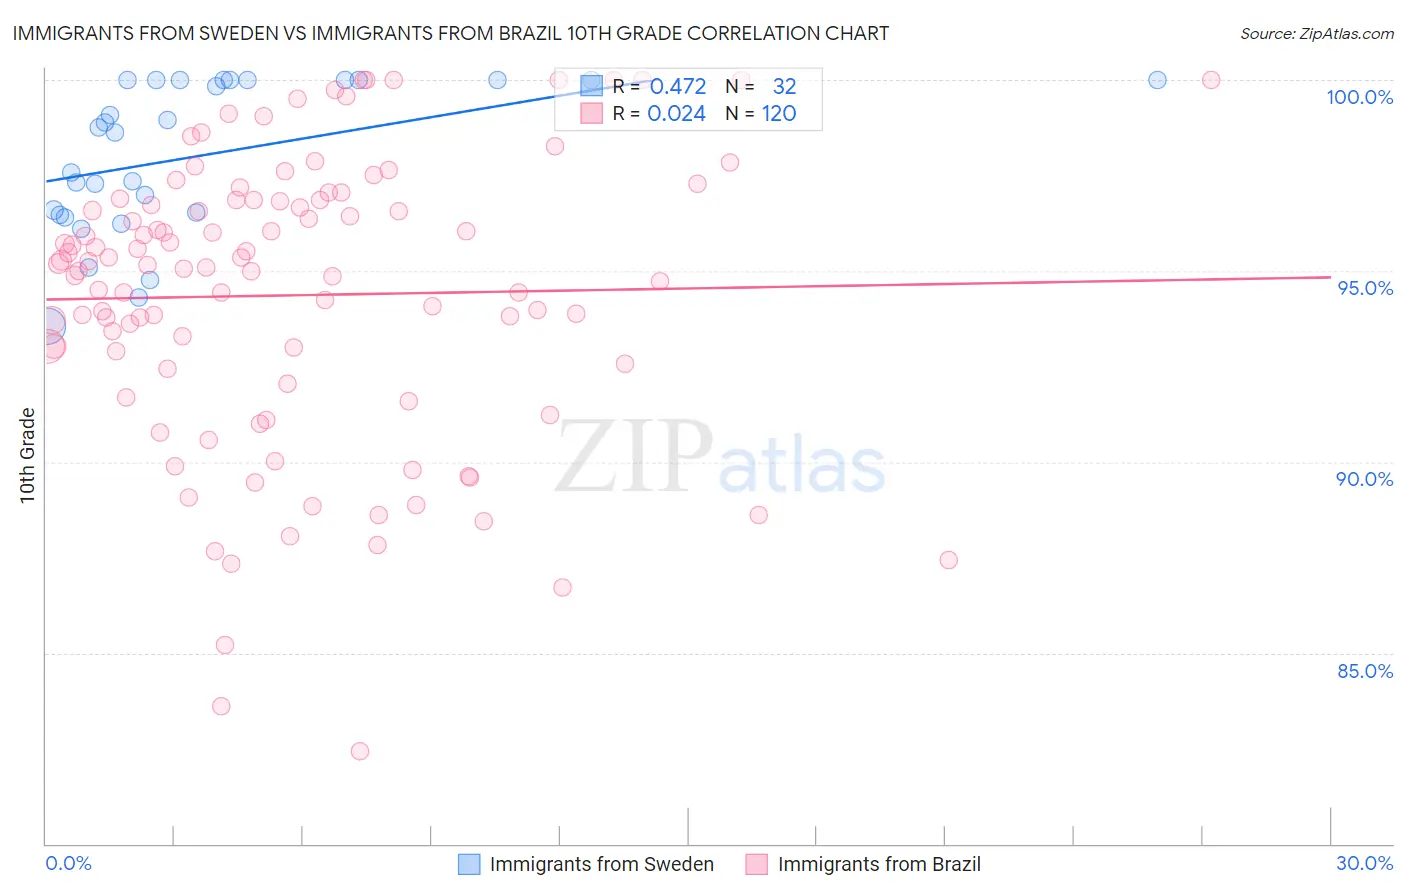
Immigrants from Sweden vs Immigrants from Brazil 10th Grade Correlation Chart
The statistical analysis conducted on geographies consisting of 164,736,894 people shows a moderate positive correlation between the proportion of Immigrants from Sweden and percentage of population with at least 10th grade education in the United States with a correlation coefficient (R) of 0.472 and weighted average of 94.9%. Similarly, the statistical analysis conducted on geographies consisting of 342,965,001 people shows no correlation between the proportion of Immigrants from Brazil and percentage of population with at least 10th grade education in the United States with a correlation coefficient (R) of 0.024 and weighted average of 94.0%, a difference of 0.97%.
10th Grade Correlation Summary
| Measurement | Immigrants from Sweden | Immigrants from Brazil |
| Minimum | 93.5% | 82.4% |
| Maximum | 100.0% | 100.0% |
| Range | 6.5% | 17.6% |
| Mean | 98.0% | 94.4% |
| Median | 98.7% | 95.1% |
| Interquartile 25% (IQ1) | 96.5% | 92.5% |
| Interquartile 75% (IQ3) | 100.0% | 96.8% |
| Interquartile Range (IQR) | 3.5% | 4.3% |
| Standard Deviation (Sample) | 2.0% | 3.8% |
| Standard Deviation (Population) | 2.0% | 3.8% |
Similar Demographics by 10th Grade
Demographics Similar to Immigrants from Sweden by 10th Grade
In terms of 10th grade, the demographic groups most similar to Immigrants from Sweden are Bhutanese (94.9%, a difference of 0.010%), Canadian (94.9%, a difference of 0.010%), Zimbabwean (94.9%, a difference of 0.020%), Alaska Native (94.9%, a difference of 0.020%), and Immigrants from England (94.9%, a difference of 0.030%).
| Demographics | Rating | Rank | 10th Grade |
| Turks | 99.7 /100 | #65 | Exceptional 95.0% |
| Immigrants | Australia | 99.7 /100 | #66 | Exceptional 94.9% |
| Immigrants | Netherlands | 99.7 /100 | #67 | Exceptional 94.9% |
| Immigrants | Belgium | 99.7 /100 | #68 | Exceptional 94.9% |
| Immigrants | England | 99.6 /100 | #69 | Exceptional 94.9% |
| Zimbabweans | 99.6 /100 | #70 | Exceptional 94.9% |
| Alaska Natives | 99.6 /100 | #71 | Exceptional 94.9% |
| Immigrants | Sweden | 99.6 /100 | #72 | Exceptional 94.9% |
| Bhutanese | 99.6 /100 | #73 | Exceptional 94.9% |
| Canadians | 99.6 /100 | #74 | Exceptional 94.9% |
| Okinawans | 99.5 /100 | #75 | Exceptional 94.8% |
| Romanians | 99.5 /100 | #76 | Exceptional 94.8% |
| Immigrants | South Africa | 99.5 /100 | #77 | Exceptional 94.8% |
| Filipinos | 99.3 /100 | #78 | Exceptional 94.8% |
| Immigrants | Czechoslovakia | 99.2 /100 | #79 | Exceptional 94.7% |
Demographics Similar to Immigrants from Brazil by 10th Grade
In terms of 10th grade, the demographic groups most similar to Immigrants from Brazil are Immigrants from Kenya (94.0%, a difference of 0.0%), Spanish (94.0%, a difference of 0.010%), Mongolian (94.0%, a difference of 0.010%), Immigrants from Italy (94.0%, a difference of 0.030%), and Kiowa (93.9%, a difference of 0.030%).
| Demographics | Rating | Rank | 10th Grade |
| Chickasaw | 82.6 /100 | #146 | Excellent 94.1% |
| Immigrants | Ukraine | 81.5 /100 | #147 | Excellent 94.0% |
| Arabs | 80.9 /100 | #148 | Excellent 94.0% |
| Ugandans | 80.7 /100 | #149 | Excellent 94.0% |
| Egyptians | 79.6 /100 | #150 | Good 94.0% |
| Kenyans | 79.1 /100 | #151 | Good 94.0% |
| Immigrants | Italy | 78.0 /100 | #152 | Good 94.0% |
| Immigrants | Brazil | 75.5 /100 | #153 | Good 94.0% |
| Immigrants | Kenya | 75.3 /100 | #154 | Good 94.0% |
| Spanish | 74.9 /100 | #155 | Good 94.0% |
| Mongolians | 74.4 /100 | #156 | Good 94.0% |
| Kiowa | 73.3 /100 | #157 | Good 93.9% |
| Bermudans | 71.0 /100 | #158 | Good 93.9% |
| Chileans | 70.2 /100 | #159 | Good 93.9% |
| Pakistanis | 70.1 /100 | #160 | Good 93.9% |