Immigrants from Sweden vs Honduran 4th Grade
COMPARE
Immigrants from Sweden
Honduran
4th Grade
4th Grade Comparison
Immigrants from Sweden
Hondurans
97.9%
4TH GRADE
98.7/ 100
METRIC RATING
91st/ 347
METRIC RANK
96.0%
4TH GRADE
0.0/ 100
METRIC RATING
327th/ 347
METRIC RANK
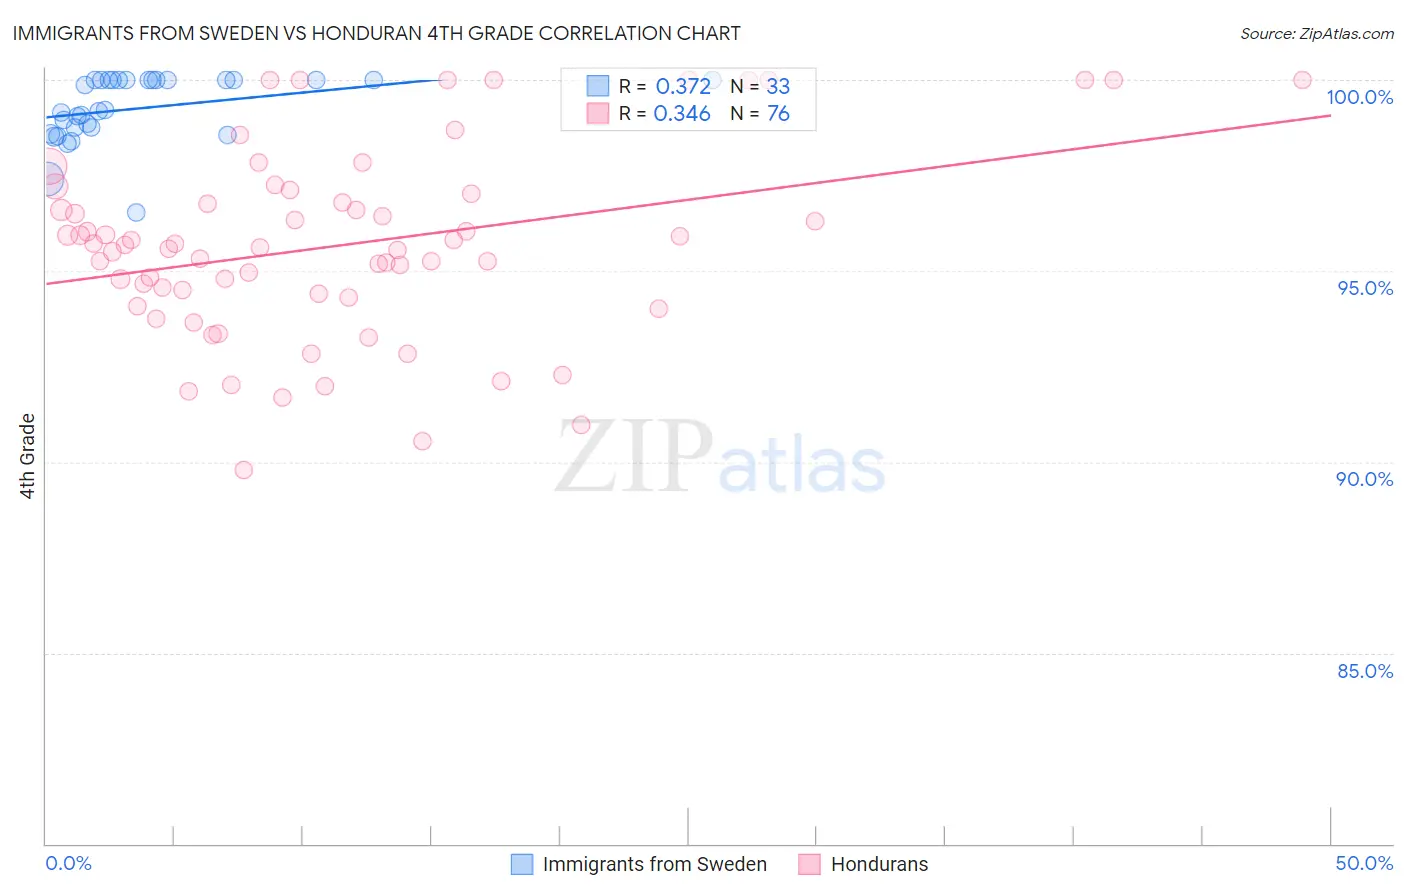
Immigrants from Sweden vs Honduran 4th Grade Correlation Chart
The statistical analysis conducted on geographies consisting of 164,737,092 people shows a mild positive correlation between the proportion of Immigrants from Sweden and percentage of population with at least 4th grade education in the United States with a correlation coefficient (R) of 0.372 and weighted average of 97.9%. Similarly, the statistical analysis conducted on geographies consisting of 357,784,803 people shows a mild positive correlation between the proportion of Hondurans and percentage of population with at least 4th grade education in the United States with a correlation coefficient (R) of 0.346 and weighted average of 96.0%, a difference of 2.1%.
4th Grade Correlation Summary
| Measurement | Immigrants from Sweden | Honduran |
| Minimum | 96.5% | 89.8% |
| Maximum | 100.0% | 100.0% |
| Range | 3.5% | 10.2% |
| Mean | 99.3% | 95.7% |
| Median | 99.2% | 95.7% |
| Interquartile 25% (IQ1) | 98.7% | 94.4% |
| Interquartile 75% (IQ3) | 100.0% | 96.9% |
| Interquartile Range (IQR) | 1.3% | 2.6% |
| Standard Deviation (Sample) | 0.86% | 2.5% |
| Standard Deviation (Population) | 0.85% | 2.4% |
Similar Demographics by 4th Grade
Demographics Similar to Immigrants from Sweden by 4th Grade
In terms of 4th grade, the demographic groups most similar to Immigrants from Sweden are Zimbabwean (97.9%, a difference of 0.0%), Immigrants from South Africa (97.9%, a difference of 0.0%), Delaware (97.9%, a difference of 0.0%), Immigrants from Denmark (97.9%, a difference of 0.0%), and Immigrants from Western Europe (97.9%, a difference of 0.0%).
| Demographics | Rating | Rank | 4th Grade |
| Cypriots | 98.9 /100 | #84 | Exceptional 97.9% |
| Potawatomi | 98.9 /100 | #85 | Exceptional 97.9% |
| Immigrants | Australia | 98.8 /100 | #86 | Exceptional 97.9% |
| Zimbabweans | 98.8 /100 | #87 | Exceptional 97.9% |
| Immigrants | South Africa | 98.8 /100 | #88 | Exceptional 97.9% |
| Delaware | 98.8 /100 | #89 | Exceptional 97.9% |
| Immigrants | Denmark | 98.7 /100 | #90 | Exceptional 97.9% |
| Immigrants | Sweden | 98.7 /100 | #91 | Exceptional 97.9% |
| Immigrants | Western Europe | 98.7 /100 | #92 | Exceptional 97.9% |
| Immigrants | Ireland | 98.7 /100 | #93 | Exceptional 97.9% |
| Shoshone | 98.7 /100 | #94 | Exceptional 97.9% |
| Immigrants | Germany | 98.5 /100 | #95 | Exceptional 97.9% |
| Romanians | 98.4 /100 | #96 | Exceptional 97.9% |
| Cheyenne | 98.4 /100 | #97 | Exceptional 97.9% |
| South Africans | 98.2 /100 | #98 | Exceptional 97.9% |
Demographics Similar to Hondurans by 4th Grade
In terms of 4th grade, the demographic groups most similar to Hondurans are Dominican (96.0%, a difference of 0.020%), Hispanic or Latino (96.0%, a difference of 0.020%), Immigrants from Belize (96.0%, a difference of 0.030%), Immigrants from Nicaragua (96.0%, a difference of 0.040%), and Japanese (96.0%, a difference of 0.060%).
| Demographics | Rating | Rank | 4th Grade |
| Bangladeshis | 0.0 /100 | #320 | Tragic 96.1% |
| Japanese | 0.0 /100 | #321 | Tragic 96.0% |
| Immigrants | Vietnam | 0.0 /100 | #322 | Tragic 96.0% |
| Immigrants | Nicaragua | 0.0 /100 | #323 | Tragic 96.0% |
| Immigrants | Belize | 0.0 /100 | #324 | Tragic 96.0% |
| Dominicans | 0.0 /100 | #325 | Tragic 96.0% |
| Hispanics or Latinos | 0.0 /100 | #326 | Tragic 96.0% |
| Hondurans | 0.0 /100 | #327 | Tragic 96.0% |
| Mexican American Indians | 0.0 /100 | #328 | Tragic 95.8% |
| Immigrants | Cambodia | 0.0 /100 | #329 | Tragic 95.8% |
| Immigrants | Fiji | 0.0 /100 | #330 | Tragic 95.8% |
| Immigrants | Armenia | 0.0 /100 | #331 | Tragic 95.8% |
| Immigrants | Honduras | 0.0 /100 | #332 | Tragic 95.8% |
| Immigrants | Dominican Republic | 0.0 /100 | #333 | Tragic 95.7% |
| Immigrants | Cabo Verde | 0.0 /100 | #334 | Tragic 95.7% |