Immigrants from Sudan vs Bolivian 8th Grade
COMPARE
Immigrants from Sudan
Bolivian
8th Grade
8th Grade Comparison
Immigrants from Sudan
Bolivians
95.5%
8TH GRADE
15.1/ 100
METRIC RATING
207th/ 347
METRIC RANK
95.0%
8TH GRADE
1.0/ 100
METRIC RATING
251st/ 347
METRIC RANK
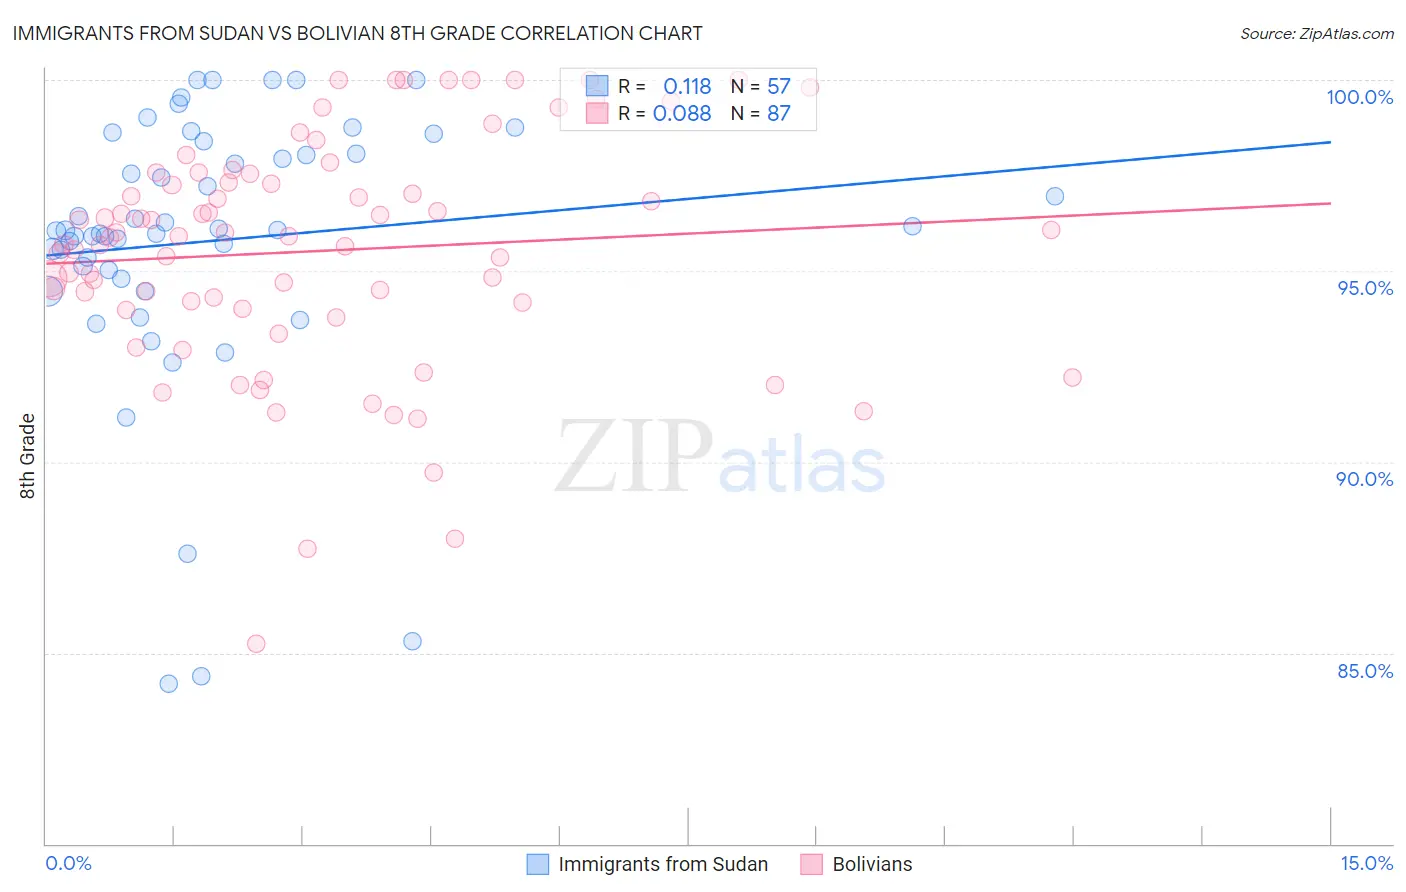
Immigrants from Sudan vs Bolivian 8th Grade Correlation Chart
The statistical analysis conducted on geographies consisting of 118,959,807 people shows a poor positive correlation between the proportion of Immigrants from Sudan and percentage of population with at least 8th grade education in the United States with a correlation coefficient (R) of 0.118 and weighted average of 95.5%. Similarly, the statistical analysis conducted on geographies consisting of 184,666,822 people shows a slight positive correlation between the proportion of Bolivians and percentage of population with at least 8th grade education in the United States with a correlation coefficient (R) of 0.088 and weighted average of 95.0%, a difference of 0.47%.
8th Grade Correlation Summary
| Measurement | Immigrants from Sudan | Bolivian |
| Minimum | 84.2% | 85.2% |
| Maximum | 100.0% | 100.0% |
| Range | 15.8% | 14.8% |
| Mean | 95.8% | 95.5% |
| Median | 96.1% | 95.9% |
| Interquartile 25% (IQ1) | 94.9% | 94.0% |
| Interquartile 75% (IQ3) | 98.2% | 97.5% |
| Interquartile Range (IQR) | 3.3% | 3.5% |
| Standard Deviation (Sample) | 3.6% | 3.0% |
| Standard Deviation (Population) | 3.5% | 3.0% |
Similar Demographics by 8th Grade
Demographics Similar to Immigrants from Sudan by 8th Grade
In terms of 8th grade, the demographic groups most similar to Immigrants from Sudan are Portuguese (95.5%, a difference of 0.010%), Hawaiian (95.5%, a difference of 0.020%), Immigrants from Bahamas (95.5%, a difference of 0.020%), Comanche (95.5%, a difference of 0.020%), and Immigrants from Lebanon (95.4%, a difference of 0.020%).
| Demographics | Rating | Rank | 8th Grade |
| Argentineans | 22.2 /100 | #200 | Fair 95.5% |
| Immigrants | Argentina | 20.6 /100 | #201 | Fair 95.5% |
| Apache | 19.4 /100 | #202 | Poor 95.5% |
| Moroccans | 17.4 /100 | #203 | Poor 95.5% |
| Hawaiians | 16.7 /100 | #204 | Poor 95.5% |
| Immigrants | Bahamas | 16.7 /100 | #205 | Poor 95.5% |
| Comanche | 16.3 /100 | #206 | Poor 95.5% |
| Immigrants | Sudan | 15.1 /100 | #207 | Poor 95.5% |
| Portuguese | 14.3 /100 | #208 | Poor 95.5% |
| Immigrants | Lebanon | 13.7 /100 | #209 | Poor 95.4% |
| Africans | 13.6 /100 | #210 | Poor 95.4% |
| Immigrants | Morocco | 12.4 /100 | #211 | Poor 95.4% |
| Immigrants | Pakistan | 9.7 /100 | #212 | Tragic 95.4% |
| Laotians | 9.0 /100 | #213 | Tragic 95.4% |
| Immigrants | Chile | 9.0 /100 | #214 | Tragic 95.4% |
Demographics Similar to Bolivians by 8th Grade
In terms of 8th grade, the demographic groups most similar to Bolivians are Immigrants from Ethiopia (95.0%, a difference of 0.0%), Immigrants from China (95.0%, a difference of 0.010%), Korean (95.0%, a difference of 0.010%), U.S. Virgin Islander (95.0%, a difference of 0.010%), and Uruguayan (95.1%, a difference of 0.030%).
| Demographics | Rating | Rank | 8th Grade |
| Immigrants | Middle Africa | 1.7 /100 | #244 | Tragic 95.1% |
| Jamaicans | 1.4 /100 | #245 | Tragic 95.1% |
| Somalis | 1.4 /100 | #246 | Tragic 95.1% |
| Immigrants | Senegal | 1.4 /100 | #247 | Tragic 95.1% |
| Uruguayans | 1.2 /100 | #248 | Tragic 95.1% |
| Immigrants | China | 1.1 /100 | #249 | Tragic 95.0% |
| Koreans | 1.1 /100 | #250 | Tragic 95.0% |
| Bolivians | 1.0 /100 | #251 | Tragic 95.0% |
| Immigrants | Ethiopia | 1.0 /100 | #252 | Tragic 95.0% |
| U.S. Virgin Islanders | 0.9 /100 | #253 | Tragic 95.0% |
| Immigrants | Cameroon | 0.8 /100 | #254 | Tragic 95.0% |
| Immigrants | Somalia | 0.7 /100 | #255 | Tragic 95.0% |
| Colombians | 0.7 /100 | #256 | Tragic 95.0% |
| Afghans | 0.6 /100 | #257 | Tragic 94.9% |
| Immigrants | Congo | 0.6 /100 | #258 | Tragic 94.9% |