Immigrants from St. Vincent and the Grenadines vs Sri Lankan Master's Degree
COMPARE
Immigrants from St. Vincent and the Grenadines
Sri Lankan
Master's Degree
Master's Degree Comparison
Immigrants from St. Vincent and the Grenadines
Sri Lankans
13.9%
MASTER'S DEGREE
11.0/ 100
METRIC RATING
226th/ 347
METRIC RANK
14.7%
MASTER'S DEGREE
39.6/ 100
METRIC RATING
183rd/ 347
METRIC RANK
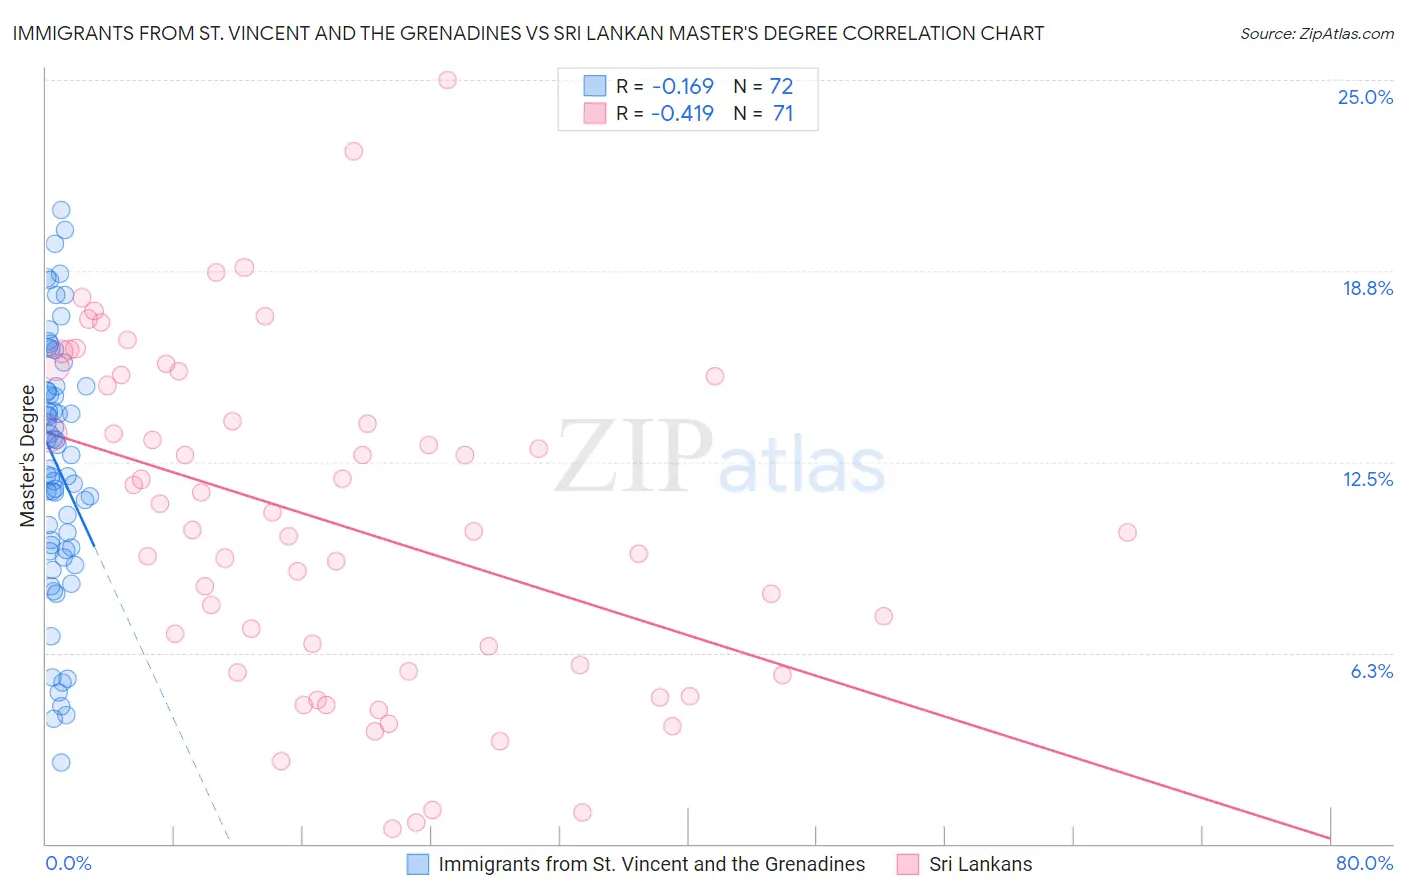
Immigrants from St. Vincent and the Grenadines vs Sri Lankan Master's Degree Correlation Chart
The statistical analysis conducted on geographies consisting of 56,186,980 people shows a poor negative correlation between the proportion of Immigrants from St. Vincent and the Grenadines and percentage of population with at least master's degree education in the United States with a correlation coefficient (R) of -0.169 and weighted average of 13.9%. Similarly, the statistical analysis conducted on geographies consisting of 440,331,802 people shows a moderate negative correlation between the proportion of Sri Lankans and percentage of population with at least master's degree education in the United States with a correlation coefficient (R) of -0.419 and weighted average of 14.7%, a difference of 5.7%.
Master's Degree Correlation Summary
| Measurement | Immigrants from St. Vincent and the Grenadines | Sri Lankan |
| Minimum | 2.6% | 0.51% |
| Maximum | 20.8% | 25.0% |
| Range | 18.1% | 24.5% |
| Mean | 12.3% | 10.5% |
| Median | 12.5% | 10.3% |
| Interquartile 25% (IQ1) | 9.6% | 5.7% |
| Interquartile 75% (IQ3) | 14.9% | 15.3% |
| Interquartile Range (IQR) | 5.3% | 9.7% |
| Standard Deviation (Sample) | 4.2% | 5.5% |
| Standard Deviation (Population) | 4.1% | 5.4% |
Similar Demographics by Master's Degree
Demographics Similar to Immigrants from St. Vincent and the Grenadines by Master's Degree
In terms of master's degree, the demographic groups most similar to Immigrants from St. Vincent and the Grenadines are Portuguese (13.9%, a difference of 0.050%), Immigrants from Grenada (14.0%, a difference of 0.26%), Immigrants from South Eastern Asia (14.0%, a difference of 0.31%), Immigrants from West Indies (13.9%, a difference of 0.44%), and Ecuadorian (14.0%, a difference of 0.51%).
| Demographics | Rating | Rank | Master's Degree |
| Norwegians | 13.6 /100 | #219 | Poor 14.0% |
| Germans | 13.1 /100 | #220 | Poor 14.0% |
| Koreans | 12.7 /100 | #221 | Poor 14.0% |
| Ecuadorians | 12.6 /100 | #222 | Poor 14.0% |
| Immigrants | South Eastern Asia | 11.9 /100 | #223 | Poor 14.0% |
| Immigrants | Grenada | 11.8 /100 | #224 | Poor 14.0% |
| Portuguese | 11.2 /100 | #225 | Poor 13.9% |
| Immigrants | St. Vincent and the Grenadines | 11.0 /100 | #226 | Poor 13.9% |
| Immigrants | West Indies | 9.8 /100 | #227 | Tragic 13.9% |
| Whites/Caucasians | 9.1 /100 | #228 | Tragic 13.8% |
| British West Indians | 8.8 /100 | #229 | Tragic 13.8% |
| Dutch | 8.7 /100 | #230 | Tragic 13.8% |
| Guyanese | 7.6 /100 | #231 | Tragic 13.7% |
| Immigrants | Philippines | 6.0 /100 | #232 | Tragic 13.6% |
| Immigrants | Ecuador | 5.7 /100 | #233 | Tragic 13.6% |
Demographics Similar to Sri Lankans by Master's Degree
In terms of master's degree, the demographic groups most similar to Sri Lankans are Immigrants from Zaire (14.7%, a difference of 0.020%), Czech (14.7%, a difference of 0.10%), Barbadian (14.7%, a difference of 0.18%), Swiss (14.7%, a difference of 0.20%), and Celtic (14.8%, a difference of 0.22%).
| Demographics | Rating | Rank | Master's Degree |
| Nigerians | 48.6 /100 | #176 | Average 14.9% |
| Immigrants | Colombia | 48.3 /100 | #177 | Average 14.9% |
| English | 45.0 /100 | #178 | Average 14.8% |
| Immigrants | Iraq | 41.3 /100 | #179 | Average 14.8% |
| Celtics | 41.3 /100 | #180 | Average 14.8% |
| Swiss | 41.1 /100 | #181 | Average 14.7% |
| Czechs | 40.4 /100 | #182 | Average 14.7% |
| Sri Lankans | 39.6 /100 | #183 | Fair 14.7% |
| Immigrants | Zaire | 39.5 /100 | #184 | Fair 14.7% |
| Barbadians | 38.3 /100 | #185 | Fair 14.7% |
| Immigrants | Oceania | 37.1 /100 | #186 | Fair 14.7% |
| Basques | 36.5 /100 | #187 | Fair 14.7% |
| Immigrants | Costa Rica | 36.2 /100 | #188 | Fair 14.7% |
| Immigrants | Immigrants | 36.0 /100 | #189 | Fair 14.6% |
| Spaniards | 35.8 /100 | #190 | Fair 14.6% |