Immigrants from Sri Lanka vs Senegalese 10th Grade
COMPARE
Immigrants from Sri Lanka
Senegalese
10th Grade
10th Grade Comparison
Immigrants from Sri Lanka
Senegalese
94.2%
10TH GRADE
89.9/ 100
METRIC RATING
138th/ 347
METRIC RANK
93.0%
10TH GRADE
2.4/ 100
METRIC RATING
243rd/ 347
METRIC RANK
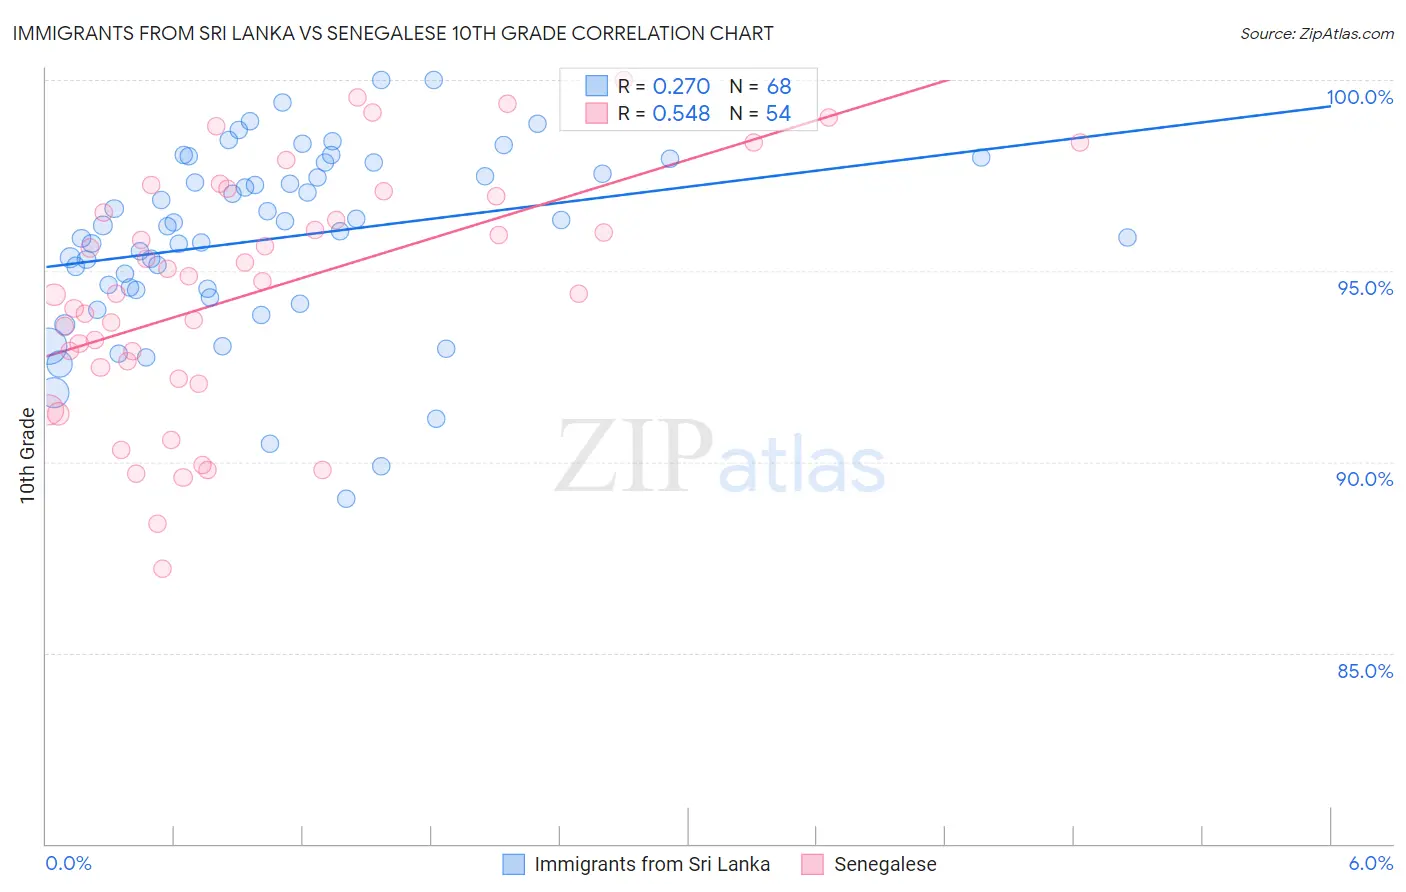
Immigrants from Sri Lanka vs Senegalese 10th Grade Correlation Chart
The statistical analysis conducted on geographies consisting of 149,660,761 people shows a weak positive correlation between the proportion of Immigrants from Sri Lanka and percentage of population with at least 10th grade education in the United States with a correlation coefficient (R) of 0.270 and weighted average of 94.2%. Similarly, the statistical analysis conducted on geographies consisting of 78,142,569 people shows a substantial positive correlation between the proportion of Senegalese and percentage of population with at least 10th grade education in the United States with a correlation coefficient (R) of 0.548 and weighted average of 93.0%, a difference of 1.3%.
10th Grade Correlation Summary
| Measurement | Immigrants from Sri Lanka | Senegalese |
| Minimum | 89.0% | 87.2% |
| Maximum | 100.0% | 100.0% |
| Range | 11.0% | 12.8% |
| Mean | 95.8% | 94.5% |
| Median | 96.2% | 94.6% |
| Interquartile 25% (IQ1) | 94.5% | 92.5% |
| Interquartile 75% (IQ3) | 97.7% | 96.9% |
| Interquartile Range (IQR) | 3.2% | 4.5% |
| Standard Deviation (Sample) | 2.4% | 3.1% |
| Standard Deviation (Population) | 2.4% | 3.1% |
Similar Demographics by 10th Grade
Demographics Similar to Immigrants from Sri Lanka by 10th Grade
In terms of 10th grade, the demographic groups most similar to Immigrants from Sri Lanka are Arapaho (94.2%, a difference of 0.010%), Immigrants from Bosnia and Herzegovina (94.2%, a difference of 0.010%), Shoshone (94.2%, a difference of 0.020%), Immigrants from Korea (94.2%, a difference of 0.040%), and Creek (94.2%, a difference of 0.050%).
| Demographics | Rating | Rank | 10th Grade |
| Immigrants | Eastern Europe | 92.5 /100 | #131 | Exceptional 94.3% |
| Immigrants | Russia | 92.4 /100 | #132 | Exceptional 94.3% |
| Creek | 91.9 /100 | #133 | Exceptional 94.2% |
| Osage | 91.7 /100 | #134 | Exceptional 94.2% |
| Immigrants | Korea | 91.3 /100 | #135 | Exceptional 94.2% |
| Shoshone | 90.8 /100 | #136 | Exceptional 94.2% |
| Arapaho | 90.5 /100 | #137 | Exceptional 94.2% |
| Immigrants | Sri Lanka | 89.9 /100 | #138 | Excellent 94.2% |
| Immigrants | Bosnia and Herzegovina | 89.4 /100 | #139 | Excellent 94.2% |
| Immigrants | Jordan | 87.6 /100 | #140 | Excellent 94.1% |
| Hmong | 86.6 /100 | #141 | Excellent 94.1% |
| Albanians | 86.5 /100 | #142 | Excellent 94.1% |
| Cherokee | 84.9 /100 | #143 | Excellent 94.1% |
| Immigrants | Kazakhstan | 84.9 /100 | #144 | Excellent 94.1% |
| Immigrants | Nonimmigrants | 83.8 /100 | #145 | Excellent 94.1% |
Demographics Similar to Senegalese by 10th Grade
In terms of 10th grade, the demographic groups most similar to Senegalese are Immigrants from Cameroon (93.0%, a difference of 0.020%), Immigrants from Somalia (93.0%, a difference of 0.030%), Spanish American (92.9%, a difference of 0.030%), Uruguayan (92.9%, a difference of 0.060%), and Immigrants from Middle Africa (92.9%, a difference of 0.080%).
| Demographics | Rating | Rank | 10th Grade |
| Afghans | 4.5 /100 | #236 | Tragic 93.1% |
| Immigrants | Panama | 4.3 /100 | #237 | Tragic 93.1% |
| Nigerians | 4.2 /100 | #238 | Tragic 93.1% |
| Costa Ricans | 4.2 /100 | #239 | Tragic 93.1% |
| Immigrants | Hong Kong | 4.2 /100 | #240 | Tragic 93.1% |
| Immigrants | Somalia | 2.7 /100 | #241 | Tragic 93.0% |
| Immigrants | Cameroon | 2.6 /100 | #242 | Tragic 93.0% |
| Senegalese | 2.4 /100 | #243 | Tragic 93.0% |
| Spanish Americans | 2.1 /100 | #244 | Tragic 92.9% |
| Uruguayans | 1.8 /100 | #245 | Tragic 92.9% |
| Immigrants | Middle Africa | 1.7 /100 | #246 | Tragic 92.9% |
| Immigrants | Afghanistan | 1.4 /100 | #247 | Tragic 92.8% |
| Colombians | 1.4 /100 | #248 | Tragic 92.8% |
| Immigrants | Senegal | 1.4 /100 | #249 | Tragic 92.8% |
| Jamaicans | 1.2 /100 | #250 | Tragic 92.8% |