Immigrants from Sri Lanka vs Pima 8th Grade
COMPARE
Immigrants from Sri Lanka
Pima
8th Grade
8th Grade Comparison
Immigrants from Sri Lanka
Pima
95.8%
8TH GRADE
64.1/ 100
METRIC RATING
163rd/ 347
METRIC RANK
95.6%
8TH GRADE
28.6/ 100
METRIC RATING
192nd/ 347
METRIC RANK
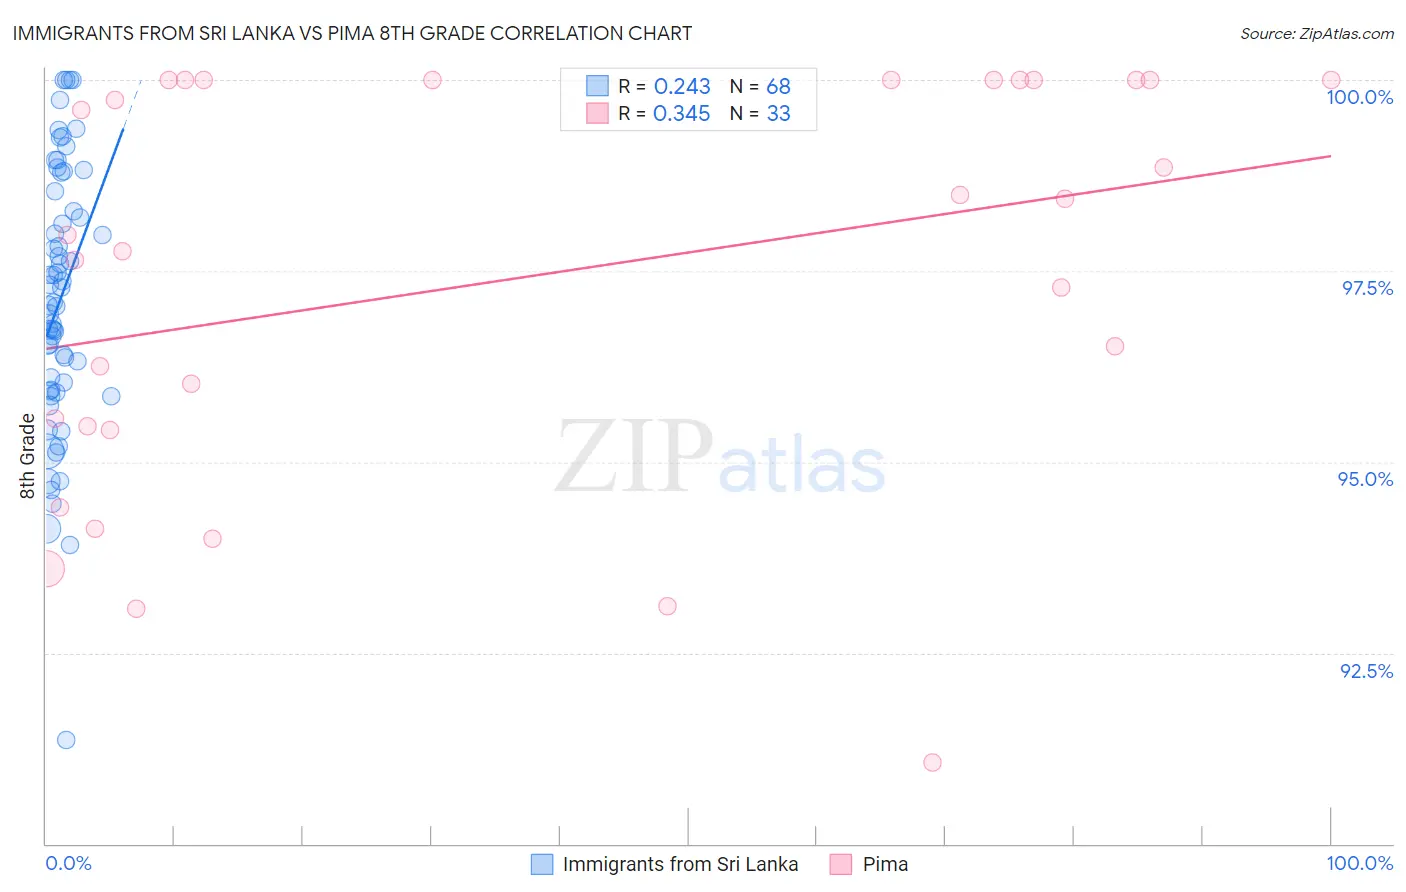
Immigrants from Sri Lanka vs Pima 8th Grade Correlation Chart
The statistical analysis conducted on geographies consisting of 149,660,761 people shows a weak positive correlation between the proportion of Immigrants from Sri Lanka and percentage of population with at least 8th grade education in the United States with a correlation coefficient (R) of 0.243 and weighted average of 95.8%. Similarly, the statistical analysis conducted on geographies consisting of 61,552,136 people shows a mild positive correlation between the proportion of Pima and percentage of population with at least 8th grade education in the United States with a correlation coefficient (R) of 0.345 and weighted average of 95.6%, a difference of 0.24%.
8th Grade Correlation Summary
| Measurement | Immigrants from Sri Lanka | Pima |
| Minimum | 91.4% | 91.1% |
| Maximum | 100.0% | 100.0% |
| Range | 8.6% | 8.9% |
| Mean | 97.1% | 97.4% |
| Median | 97.1% | 98.0% |
| Interquartile 25% (IQ1) | 95.9% | 95.4% |
| Interquartile 75% (IQ3) | 98.4% | 100.0% |
| Interquartile Range (IQR) | 2.5% | 4.6% |
| Standard Deviation (Sample) | 1.7% | 2.7% |
| Standard Deviation (Population) | 1.7% | 2.6% |
Similar Demographics by 8th Grade
Demographics Similar to Immigrants from Sri Lanka by 8th Grade
In terms of 8th grade, the demographic groups most similar to Immigrants from Sri Lanka are Immigrants from Italy (95.8%, a difference of 0.0%), Bermudan (95.8%, a difference of 0.020%), Immigrants from Kenya (95.8%, a difference of 0.020%), Alsatian (95.8%, a difference of 0.020%), and Immigrants from Poland (95.8%, a difference of 0.020%).
| Demographics | Rating | Rank | 8th Grade |
| Ugandans | 74.1 /100 | #156 | Good 95.9% |
| Immigrants | Taiwan | 70.5 /100 | #157 | Good 95.9% |
| Arabs | 69.4 /100 | #158 | Good 95.9% |
| Immigrants | Kazakhstan | 68.4 /100 | #159 | Good 95.9% |
| Seminole | 67.7 /100 | #160 | Good 95.8% |
| Bermudans | 67.5 /100 | #161 | Good 95.8% |
| Immigrants | Kenya | 67.2 /100 | #162 | Good 95.8% |
| Immigrants | Sri Lanka | 64.1 /100 | #163 | Good 95.8% |
| Immigrants | Italy | 63.5 /100 | #164 | Good 95.8% |
| Alsatians | 61.4 /100 | #165 | Good 95.8% |
| Immigrants | Poland | 61.1 /100 | #166 | Good 95.8% |
| Spaniards | 60.0 /100 | #167 | Good 95.8% |
| Immigrants | Ukraine | 59.5 /100 | #168 | Average 95.8% |
| Immigrants | Iran | 58.6 /100 | #169 | Average 95.8% |
| Ute | 58.5 /100 | #170 | Average 95.8% |
Demographics Similar to Pima by 8th Grade
In terms of 8th grade, the demographic groups most similar to Pima are Panamanian (95.6%, a difference of 0.0%), Immigrants from Nepal (95.6%, a difference of 0.010%), Immigrants from Micronesia (95.6%, a difference of 0.020%), Immigrants from Venezuela (95.6%, a difference of 0.020%), and Guamanian/Chamorro (95.6%, a difference of 0.020%).
| Demographics | Rating | Rank | 8th Grade |
| Blacks/African Americans | 34.8 /100 | #185 | Fair 95.6% |
| Brazilians | 34.8 /100 | #186 | Fair 95.6% |
| Sudanese | 33.0 /100 | #187 | Fair 95.6% |
| Liberians | 32.4 /100 | #188 | Fair 95.6% |
| Immigrants | Micronesia | 31.6 /100 | #189 | Fair 95.6% |
| Immigrants | Venezuela | 30.8 /100 | #190 | Fair 95.6% |
| Immigrants | Nepal | 30.2 /100 | #191 | Fair 95.6% |
| Pima | 28.6 /100 | #192 | Fair 95.6% |
| Panamanians | 28.4 /100 | #193 | Fair 95.6% |
| Guamanians/Chamorros | 26.6 /100 | #194 | Fair 95.6% |
| Immigrants | Zaire | 25.2 /100 | #195 | Fair 95.6% |
| Assyrians/Chaldeans/Syriacs | 24.5 /100 | #196 | Fair 95.6% |
| Sierra Leoneans | 24.3 /100 | #197 | Fair 95.6% |
| Paraguayans | 22.6 /100 | #198 | Fair 95.5% |
| Immigrants | Northern Africa | 22.5 /100 | #199 | Fair 95.5% |