Immigrants from Spain vs Pima 6th Grade
COMPARE
Immigrants from Spain
Pima
6th Grade
6th Grade Comparison
Immigrants from Spain
Pima
97.0%
6TH GRADE
39.9/ 100
METRIC RATING
180th/ 347
METRIC RANK
97.2%
6TH GRADE
82.9/ 100
METRIC RATING
143rd/ 347
METRIC RANK
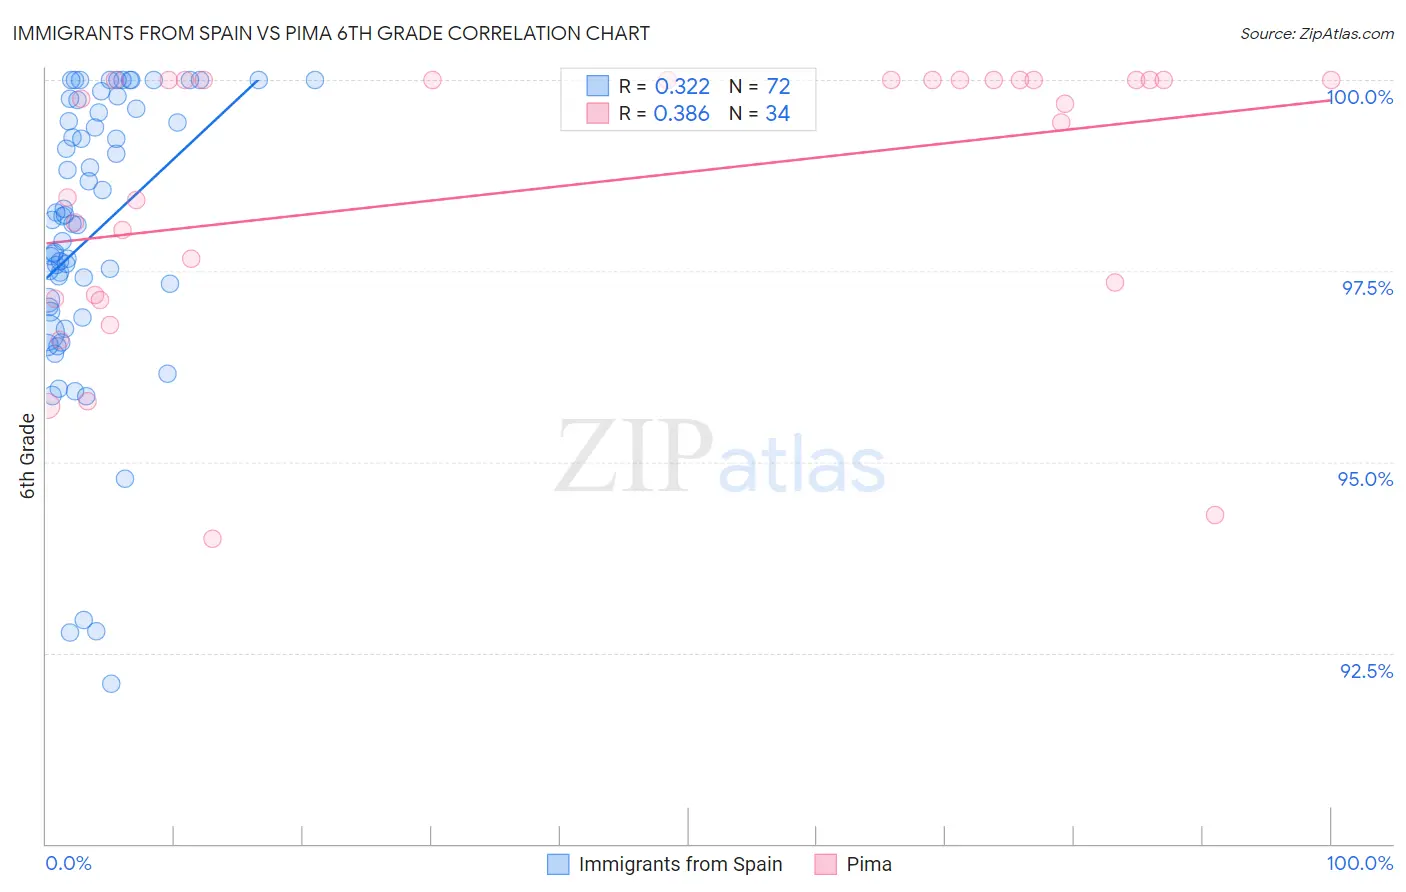
Immigrants from Spain vs Pima 6th Grade Correlation Chart
The statistical analysis conducted on geographies consisting of 239,682,725 people shows a mild positive correlation between the proportion of Immigrants from Spain and percentage of population with at least 6th grade education in the United States with a correlation coefficient (R) of 0.322 and weighted average of 97.0%. Similarly, the statistical analysis conducted on geographies consisting of 61,552,942 people shows a mild positive correlation between the proportion of Pima and percentage of population with at least 6th grade education in the United States with a correlation coefficient (R) of 0.386 and weighted average of 97.2%, a difference of 0.23%.
6th Grade Correlation Summary
| Measurement | Immigrants from Spain | Pima |
| Minimum | 92.1% | 94.0% |
| Maximum | 100.0% | 100.0% |
| Range | 7.9% | 6.0% |
| Mean | 98.0% | 98.6% |
| Median | 98.1% | 99.7% |
| Interquartile 25% (IQ1) | 97.0% | 97.2% |
| Interquartile 75% (IQ3) | 99.6% | 100.0% |
| Interquartile Range (IQR) | 2.6% | 2.8% |
| Standard Deviation (Sample) | 1.9% | 1.8% |
| Standard Deviation (Population) | 1.9% | 1.8% |
Similar Demographics by 6th Grade
Demographics Similar to Immigrants from Spain by 6th Grade
In terms of 6th grade, the demographic groups most similar to Immigrants from Spain are Comanche (97.0%, a difference of 0.010%), Immigrants from Ukraine (97.0%, a difference of 0.020%), Immigrants from Kazakhstan (97.0%, a difference of 0.030%), Immigrants from Micronesia (97.0%, a difference of 0.030%), and Mongolian (97.0%, a difference of 0.030%).
| Demographics | Rating | Rank | 6th Grade |
| Arabs | 50.1 /100 | #173 | Average 97.0% |
| Venezuelans | 50.0 /100 | #174 | Average 97.0% |
| Immigrants | Kazakhstan | 47.3 /100 | #175 | Average 97.0% |
| Immigrants | Micronesia | 47.1 /100 | #176 | Average 97.0% |
| Mongolians | 46.7 /100 | #177 | Average 97.0% |
| Pakistanis | 46.0 /100 | #178 | Average 97.0% |
| Immigrants | Kenya | 45.3 /100 | #179 | Average 97.0% |
| Immigrants | Spain | 39.9 /100 | #180 | Fair 97.0% |
| Comanche | 37.9 /100 | #181 | Fair 97.0% |
| Immigrants | Ukraine | 35.6 /100 | #182 | Fair 97.0% |
| Immigrants | Venezuela | 34.5 /100 | #183 | Fair 97.0% |
| Spanish Americans | 33.5 /100 | #184 | Fair 97.0% |
| Argentineans | 33.0 /100 | #185 | Fair 97.0% |
| Immigrants | Egypt | 31.4 /100 | #186 | Fair 97.0% |
| Guamanians/Chamorros | 30.6 /100 | #187 | Fair 97.0% |
Demographics Similar to Pima by 6th Grade
In terms of 6th grade, the demographic groups most similar to Pima are Israeli (97.2%, a difference of 0.0%), Jordanian (97.2%, a difference of 0.010%), Immigrants from North Macedonia (97.2%, a difference of 0.020%), Seminole (97.2%, a difference of 0.020%), and Spaniard (97.2%, a difference of 0.020%).
| Demographics | Rating | Rank | 6th Grade |
| Filipinos | 88.9 /100 | #136 | Excellent 97.3% |
| Burmese | 87.8 /100 | #137 | Excellent 97.3% |
| Blackfeet | 87.7 /100 | #138 | Excellent 97.3% |
| Immigrants | Turkey | 86.1 /100 | #139 | Excellent 97.3% |
| Immigrants | North Macedonia | 85.5 /100 | #140 | Excellent 97.2% |
| Seminole | 84.8 /100 | #141 | Excellent 97.2% |
| Jordanians | 84.6 /100 | #142 | Excellent 97.2% |
| Pima | 82.9 /100 | #143 | Excellent 97.2% |
| Israelis | 82.9 /100 | #144 | Excellent 97.2% |
| Spaniards | 80.1 /100 | #145 | Excellent 97.2% |
| Hopi | 78.8 /100 | #146 | Good 97.2% |
| Immigrants | South Central Asia | 78.1 /100 | #147 | Good 97.2% |
| Immigrants | Greece | 77.8 /100 | #148 | Good 97.2% |
| Immigrants | Israel | 76.0 /100 | #149 | Good 97.2% |
| Immigrants | Bosnia and Herzegovina | 74.8 /100 | #150 | Good 97.2% |