Immigrants from Southern Europe vs Indian (Asian) Nursery School
COMPARE
Immigrants from Southern Europe
Indian (Asian)
Nursery School
Nursery School Comparison
Immigrants from Southern Europe
Indians (Asian)
97.9%
NURSERY SCHOOL
17.4/ 100
METRIC RATING
204th/ 347
METRIC RANK
97.6%
NURSERY SCHOOL
0.9/ 100
METRIC RATING
248th/ 347
METRIC RANK
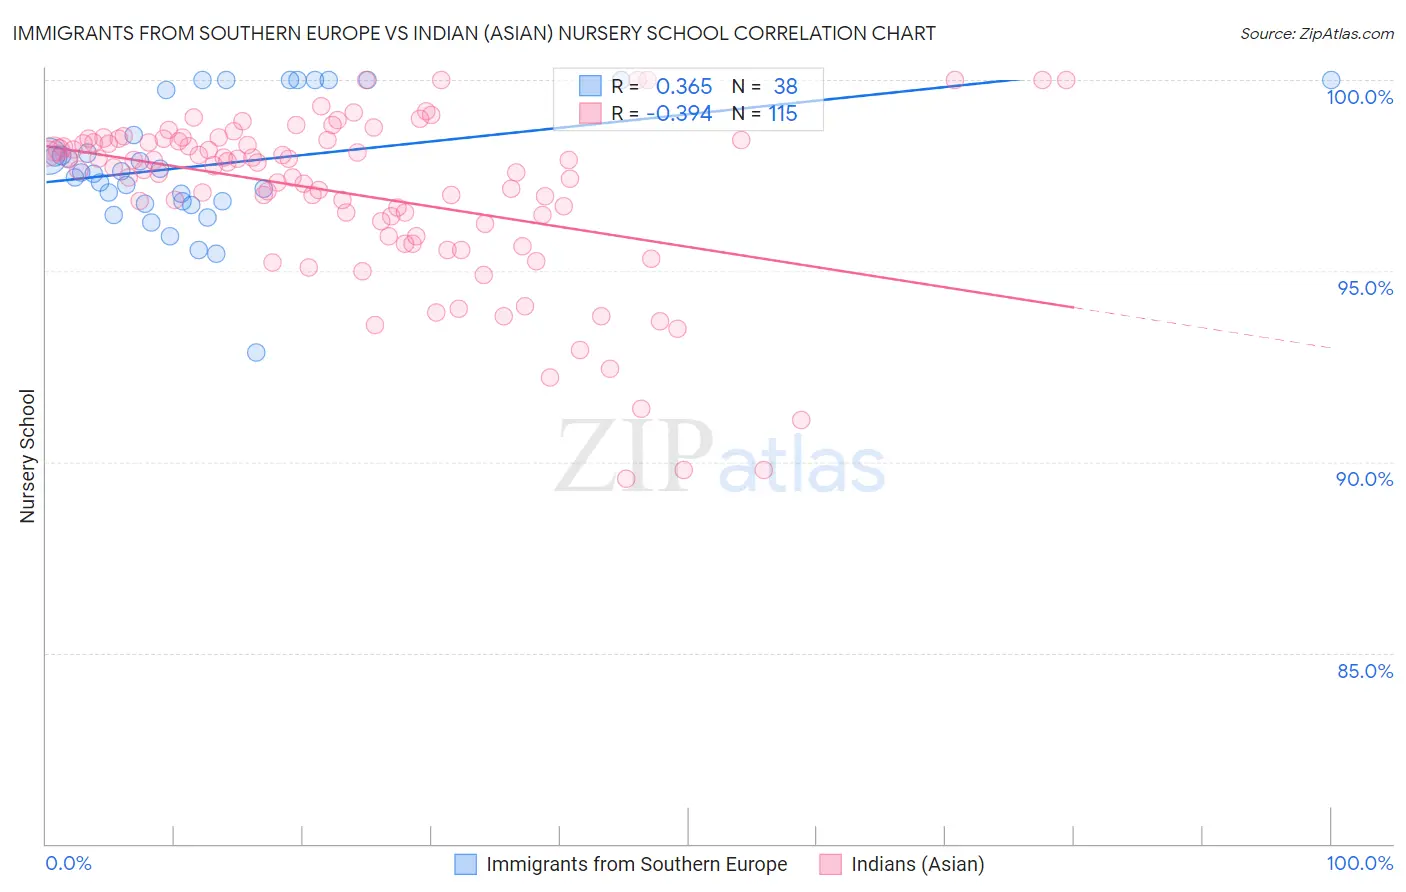
Immigrants from Southern Europe vs Indian (Asian) Nursery School Correlation Chart
The statistical analysis conducted on geographies consisting of 402,804,595 people shows a mild positive correlation between the proportion of Immigrants from Southern Europe and percentage of population with at least nursery school education in the United States with a correlation coefficient (R) of 0.365 and weighted average of 97.9%. Similarly, the statistical analysis conducted on geographies consisting of 495,196,037 people shows a mild negative correlation between the proportion of Indians (Asian) and percentage of population with at least nursery school education in the United States with a correlation coefficient (R) of -0.394 and weighted average of 97.6%, a difference of 0.24%.
Nursery School Correlation Summary
| Measurement | Immigrants from Southern Europe | Indian (Asian) |
| Minimum | 92.9% | 89.6% |
| Maximum | 100.0% | 100.0% |
| Range | 7.1% | 10.4% |
| Mean | 97.8% | 97.0% |
| Median | 97.6% | 97.7% |
| Interquartile 25% (IQ1) | 96.8% | 95.9% |
| Interquartile 75% (IQ3) | 99.8% | 98.4% |
| Interquartile Range (IQR) | 2.9% | 2.5% |
| Standard Deviation (Sample) | 1.6% | 2.2% |
| Standard Deviation (Population) | 1.6% | 2.2% |
Similar Demographics by Nursery School
Demographics Similar to Immigrants from Southern Europe by Nursery School
In terms of nursery school, the demographic groups most similar to Immigrants from Southern Europe are Immigrants from Uganda (97.9%, a difference of 0.0%), Immigrants from Chile (97.9%, a difference of 0.0%), Immigrants from Ukraine (97.9%, a difference of 0.010%), Immigrants from Albania (97.9%, a difference of 0.010%), and African (97.9%, a difference of 0.010%).
| Demographics | Rating | Rank | Nursery School |
| Yuman | 25.7 /100 | #197 | Fair 97.9% |
| Immigrants | Kenya | 24.1 /100 | #198 | Fair 97.9% |
| Immigrants | Egypt | 22.5 /100 | #199 | Fair 97.9% |
| Tohono O'odham | 22.2 /100 | #200 | Fair 97.9% |
| Immigrants | Lebanon | 21.2 /100 | #201 | Fair 97.9% |
| Immigrants | Ukraine | 19.9 /100 | #202 | Poor 97.9% |
| Immigrants | Uganda | 18.0 /100 | #203 | Poor 97.9% |
| Immigrants | Southern Europe | 17.4 /100 | #204 | Poor 97.9% |
| Immigrants | Chile | 17.3 /100 | #205 | Poor 97.9% |
| Immigrants | Albania | 16.4 /100 | #206 | Poor 97.9% |
| Africans | 15.4 /100 | #207 | Poor 97.9% |
| Immigrants | Northern Africa | 11.7 /100 | #208 | Poor 97.8% |
| Costa Ricans | 11.3 /100 | #209 | Poor 97.8% |
| Immigrants | Oceania | 10.2 /100 | #210 | Poor 97.8% |
| Laotians | 9.8 /100 | #211 | Tragic 97.8% |
Demographics Similar to Indians (Asian) by Nursery School
In terms of nursery school, the demographic groups most similar to Indians (Asian) are Peruvian (97.6%, a difference of 0.0%), Immigrants from Middle Africa (97.6%, a difference of 0.0%), Immigrants from Eastern Africa (97.6%, a difference of 0.0%), Immigrants from Senegal (97.6%, a difference of 0.0%), and Liberian (97.7%, a difference of 0.010%).
| Demographics | Rating | Rank | Nursery School |
| Immigrants | Indonesia | 1.1 /100 | #241 | Tragic 97.7% |
| Liberians | 1.1 /100 | #242 | Tragic 97.7% |
| Asians | 1.1 /100 | #243 | Tragic 97.6% |
| South Americans | 1.0 /100 | #244 | Tragic 97.6% |
| Bolivians | 1.0 /100 | #245 | Tragic 97.6% |
| Peruvians | 1.0 /100 | #246 | Tragic 97.6% |
| Immigrants | Middle Africa | 0.9 /100 | #247 | Tragic 97.6% |
| Indians (Asian) | 0.9 /100 | #248 | Tragic 97.6% |
| Immigrants | Eastern Africa | 0.9 /100 | #249 | Tragic 97.6% |
| Immigrants | Senegal | 0.9 /100 | #250 | Tragic 97.6% |
| Ethiopians | 0.8 /100 | #251 | Tragic 97.6% |
| Immigrants | Africa | 0.8 /100 | #252 | Tragic 97.6% |
| Immigrants | Iraq | 0.7 /100 | #253 | Tragic 97.6% |
| Immigrants | Congo | 0.7 /100 | #254 | Tragic 97.6% |
| Immigrants | Asia | 0.7 /100 | #255 | Tragic 97.6% |