Immigrants from Southern Europe vs Immigrants from Jordan 11th Grade
COMPARE
Immigrants from Southern Europe
Immigrants from Jordan
11th Grade
11th Grade Comparison
Immigrants from Southern Europe
Immigrants from Jordan
92.1%
11TH GRADE
12.5/ 100
METRIC RATING
215th/ 347
METRIC RANK
93.1%
11TH GRADE
92.4/ 100
METRIC RATING
128th/ 347
METRIC RANK
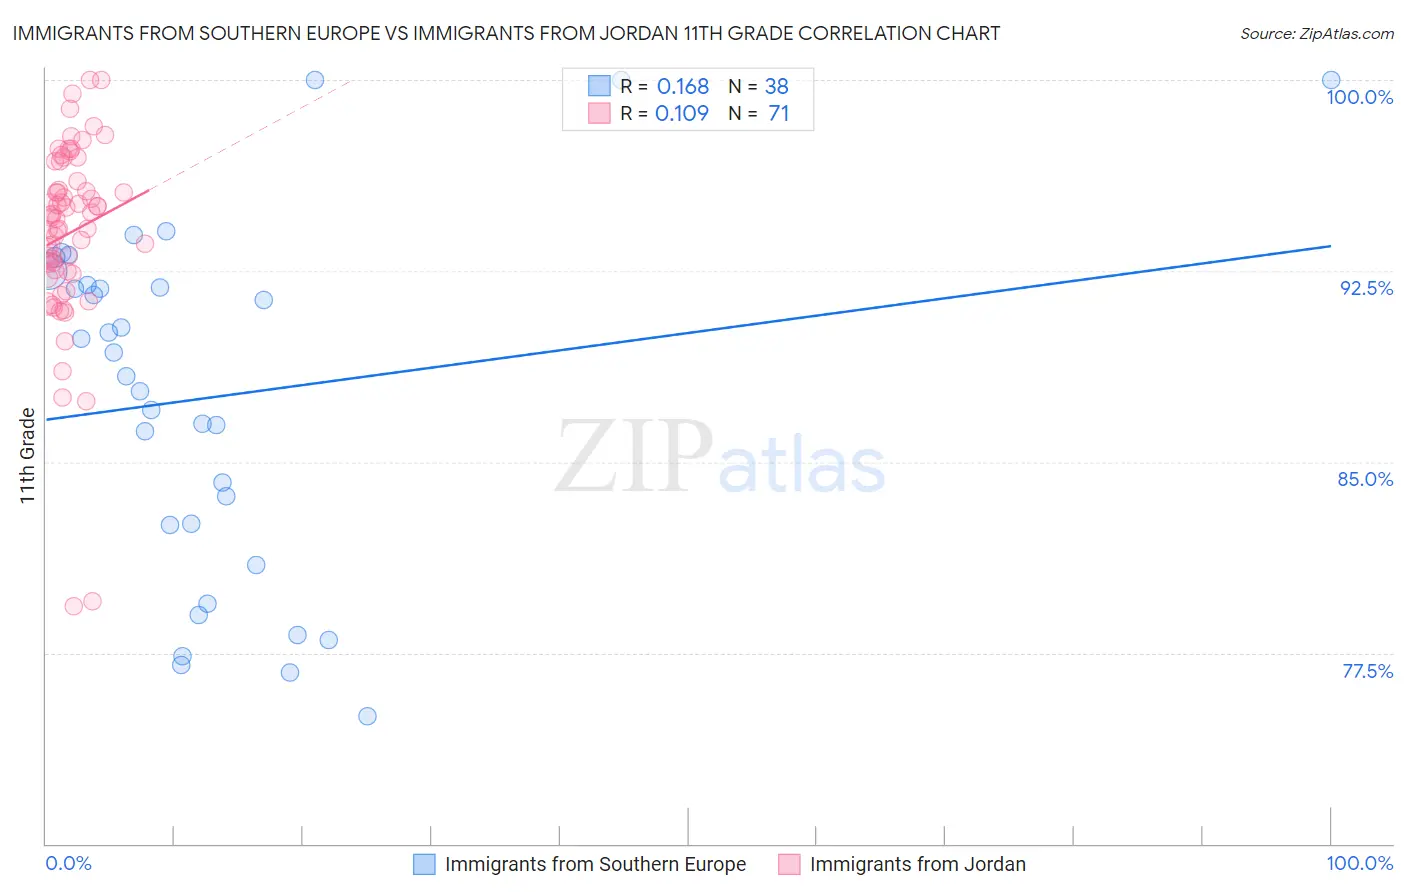
Immigrants from Southern Europe vs Immigrants from Jordan 11th Grade Correlation Chart
The statistical analysis conducted on geographies consisting of 402,804,595 people shows a poor positive correlation between the proportion of Immigrants from Southern Europe and percentage of population with at least 11th grade education in the United States with a correlation coefficient (R) of 0.168 and weighted average of 92.1%. Similarly, the statistical analysis conducted on geographies consisting of 181,278,272 people shows a poor positive correlation between the proportion of Immigrants from Jordan and percentage of population with at least 11th grade education in the United States with a correlation coefficient (R) of 0.109 and weighted average of 93.1%, a difference of 1.1%.
11th Grade Correlation Summary
| Measurement | Immigrants from Southern Europe | Immigrants from Jordan |
| Minimum | 75.0% | 79.3% |
| Maximum | 100.0% | 100.0% |
| Range | 25.0% | 20.7% |
| Mean | 87.5% | 94.0% |
| Median | 88.8% | 94.6% |
| Interquartile 25% (IQ1) | 82.5% | 92.5% |
| Interquartile 75% (IQ3) | 92.0% | 96.0% |
| Interquartile Range (IQR) | 9.4% | 3.5% |
| Standard Deviation (Sample) | 6.8% | 3.7% |
| Standard Deviation (Population) | 6.7% | 3.7% |
Similar Demographics by 11th Grade
Demographics Similar to Immigrants from Southern Europe by 11th Grade
In terms of 11th grade, the demographic groups most similar to Immigrants from Southern Europe are Afghan (92.1%, a difference of 0.010%), Somali (92.1%, a difference of 0.020%), Immigrants from Ethiopia (92.1%, a difference of 0.030%), Immigrants from Sierra Leone (92.0%, a difference of 0.030%), and Korean (92.1%, a difference of 0.040%).
| Demographics | Rating | Rank | 11th Grade |
| Colville | 21.8 /100 | #208 | Fair 92.2% |
| Tongans | 19.8 /100 | #209 | Poor 92.2% |
| Ethiopians | 18.8 /100 | #210 | Poor 92.2% |
| Immigrants | Micronesia | 17.7 /100 | #211 | Poor 92.2% |
| Koreans | 14.4 /100 | #212 | Poor 92.1% |
| Immigrants | Ethiopia | 13.9 /100 | #213 | Poor 92.1% |
| Afghans | 12.8 /100 | #214 | Poor 92.1% |
| Immigrants | Southern Europe | 12.5 /100 | #215 | Poor 92.1% |
| Somalis | 11.6 /100 | #216 | Poor 92.1% |
| Immigrants | Sierra Leone | 11.1 /100 | #217 | Poor 92.0% |
| Blackfeet | 10.1 /100 | #218 | Poor 92.0% |
| Portuguese | 10.0 /100 | #219 | Tragic 92.0% |
| South American Indians | 7.6 /100 | #220 | Tragic 92.0% |
| Immigrants | Liberia | 7.0 /100 | #221 | Tragic 91.9% |
| Immigrants | Africa | 6.5 /100 | #222 | Tragic 91.9% |
Demographics Similar to Immigrants from Jordan by 11th Grade
In terms of 11th grade, the demographic groups most similar to Immigrants from Jordan are Immigrants from Kazakhstan (93.1%, a difference of 0.0%), Immigrants from Ukraine (93.0%, a difference of 0.080%), Albanian (93.0%, a difference of 0.090%), Egyptian (93.0%, a difference of 0.090%), and Immigrants from Bosnia and Herzegovina (93.0%, a difference of 0.10%).
| Demographics | Rating | Rank | 11th Grade |
| German Russians | 96.4 /100 | #121 | Exceptional 93.3% |
| Immigrants | Belarus | 96.3 /100 | #122 | Exceptional 93.3% |
| Immigrants | Greece | 95.9 /100 | #123 | Exceptional 93.2% |
| Immigrants | Eastern Europe | 95.9 /100 | #124 | Exceptional 93.2% |
| Immigrants | Sri Lanka | 95.6 /100 | #125 | Exceptional 93.2% |
| Basques | 95.2 /100 | #126 | Exceptional 93.2% |
| Immigrants | Kazakhstan | 92.4 /100 | #127 | Exceptional 93.1% |
| Immigrants | Jordan | 92.4 /100 | #128 | Exceptional 93.1% |
| Immigrants | Ukraine | 89.8 /100 | #129 | Excellent 93.0% |
| Albanians | 89.5 /100 | #130 | Excellent 93.0% |
| Egyptians | 89.5 /100 | #131 | Excellent 93.0% |
| Immigrants | Bosnia and Herzegovina | 89.0 /100 | #132 | Excellent 93.0% |
| Mongolians | 87.6 /100 | #133 | Excellent 93.0% |
| Delaware | 87.3 /100 | #134 | Excellent 93.0% |
| Immigrants | Italy | 86.6 /100 | #135 | Excellent 92.9% |