Immigrants from Southern Europe vs Immigrants from Italy 12th Grade, No Diploma
COMPARE
Immigrants from Southern Europe
Immigrants from Italy
12th Grade, No Diploma
12th Grade, No Diploma Comparison
Immigrants from Southern Europe
Immigrants from Italy
90.8%
12TH GRADE, NO DIPLOMA
19.9/ 100
METRIC RATING
199th/ 347
METRIC RANK
91.7%
12TH GRADE, NO DIPLOMA
88.3/ 100
METRIC RATING
133rd/ 347
METRIC RANK
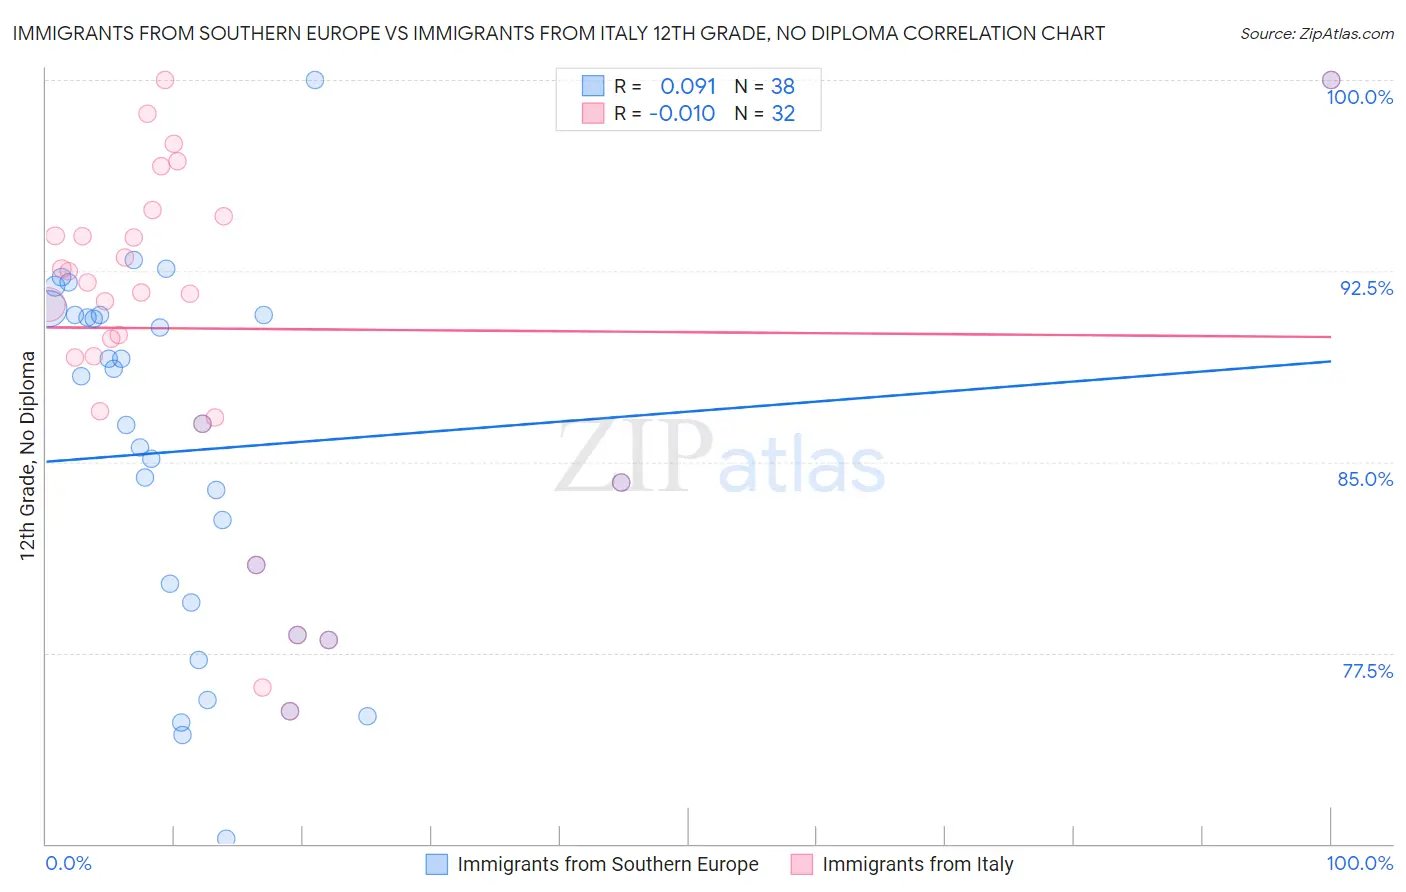
Immigrants from Southern Europe vs Immigrants from Italy 12th Grade, No Diploma Correlation Chart
The statistical analysis conducted on geographies consisting of 402,804,595 people shows a slight positive correlation between the proportion of Immigrants from Southern Europe and percentage of population with at least 12th grade (no diploma) education in the United States with a correlation coefficient (R) of 0.091 and weighted average of 90.8%. Similarly, the statistical analysis conducted on geographies consisting of 324,226,009 people shows no correlation between the proportion of Immigrants from Italy and percentage of population with at least 12th grade (no diploma) education in the United States with a correlation coefficient (R) of -0.010 and weighted average of 91.7%, a difference of 1.1%.
12th Grade, No Diploma Correlation Summary
| Measurement | Immigrants from Southern Europe | Immigrants from Italy |
| Minimum | 70.2% | 75.2% |
| Maximum | 100.0% | 100.0% |
| Range | 29.8% | 24.8% |
| Mean | 85.5% | 90.2% |
| Median | 86.5% | 91.6% |
| Interquartile 25% (IQ1) | 79.5% | 86.9% |
| Interquartile 75% (IQ3) | 90.8% | 94.3% |
| Interquartile Range (IQR) | 11.3% | 7.4% |
| Standard Deviation (Sample) | 7.3% | 6.7% |
| Standard Deviation (Population) | 7.2% | 6.6% |
Similar Demographics by 12th Grade, No Diploma
Demographics Similar to Immigrants from Southern Europe by 12th Grade, No Diploma
In terms of 12th grade, no diploma, the demographic groups most similar to Immigrants from Southern Europe are Liberian (90.8%, a difference of 0.0%), Hawaiian (90.8%, a difference of 0.0%), Samoan (90.8%, a difference of 0.010%), Marshallese (90.7%, a difference of 0.030%), and Panamanian (90.8%, a difference of 0.050%).
| Demographics | Rating | Rank | 12th Grade, No Diploma |
| Immigrants | Eastern Africa | 27.7 /100 | #192 | Fair 90.9% |
| Immigrants | Ethiopia | 27.2 /100 | #193 | Fair 90.9% |
| Immigrants | Oceania | 26.0 /100 | #194 | Fair 90.9% |
| Koreans | 24.5 /100 | #195 | Fair 90.8% |
| Panamanians | 22.8 /100 | #196 | Fair 90.8% |
| Immigrants | Sudan | 22.6 /100 | #197 | Fair 90.8% |
| Samoans | 20.4 /100 | #198 | Fair 90.8% |
| Immigrants | Southern Europe | 19.9 /100 | #199 | Poor 90.8% |
| Liberians | 19.8 /100 | #200 | Poor 90.8% |
| Hawaiians | 19.7 /100 | #201 | Poor 90.8% |
| Marshallese | 18.2 /100 | #202 | Poor 90.7% |
| Tongans | 16.1 /100 | #203 | Poor 90.7% |
| French American Indians | 15.5 /100 | #204 | Poor 90.7% |
| Immigrants | Sierra Leone | 14.9 /100 | #205 | Poor 90.7% |
| Immigrants | Bolivia | 12.3 /100 | #206 | Poor 90.6% |
Demographics Similar to Immigrants from Italy by 12th Grade, No Diploma
In terms of 12th grade, no diploma, the demographic groups most similar to Immigrants from Italy are Venezuelan (91.7%, a difference of 0.0%), Albanian (91.8%, a difference of 0.030%), Immigrants from Eastern Asia (91.8%, a difference of 0.030%), Immigrants from Bosnia and Herzegovina (91.7%, a difference of 0.030%), and Assyrian/Chaldean/Syriac (91.8%, a difference of 0.040%).
| Demographics | Rating | Rank | 12th Grade, No Diploma |
| Basques | 91.3 /100 | #126 | Exceptional 91.8% |
| Immigrants | Jordan | 91.0 /100 | #127 | Exceptional 91.8% |
| Mongolians | 89.9 /100 | #128 | Excellent 91.8% |
| German Russians | 89.8 /100 | #129 | Excellent 91.8% |
| Assyrians/Chaldeans/Syriacs | 89.6 /100 | #130 | Excellent 91.8% |
| Albanians | 89.3 /100 | #131 | Excellent 91.8% |
| Immigrants | Eastern Asia | 89.3 /100 | #132 | Excellent 91.8% |
| Immigrants | Italy | 88.3 /100 | #133 | Excellent 91.7% |
| Venezuelans | 88.2 /100 | #134 | Excellent 91.7% |
| Immigrants | Bosnia and Herzegovina | 87.3 /100 | #135 | Excellent 91.7% |
| Chileans | 85.8 /100 | #136 | Excellent 91.7% |
| Alaska Natives | 84.9 /100 | #137 | Excellent 91.6% |
| Arabs | 84.1 /100 | #138 | Excellent 91.6% |
| Immigrants | Egypt | 83.9 /100 | #139 | Excellent 91.6% |
| Immigrants | Poland | 82.3 /100 | #140 | Excellent 91.6% |